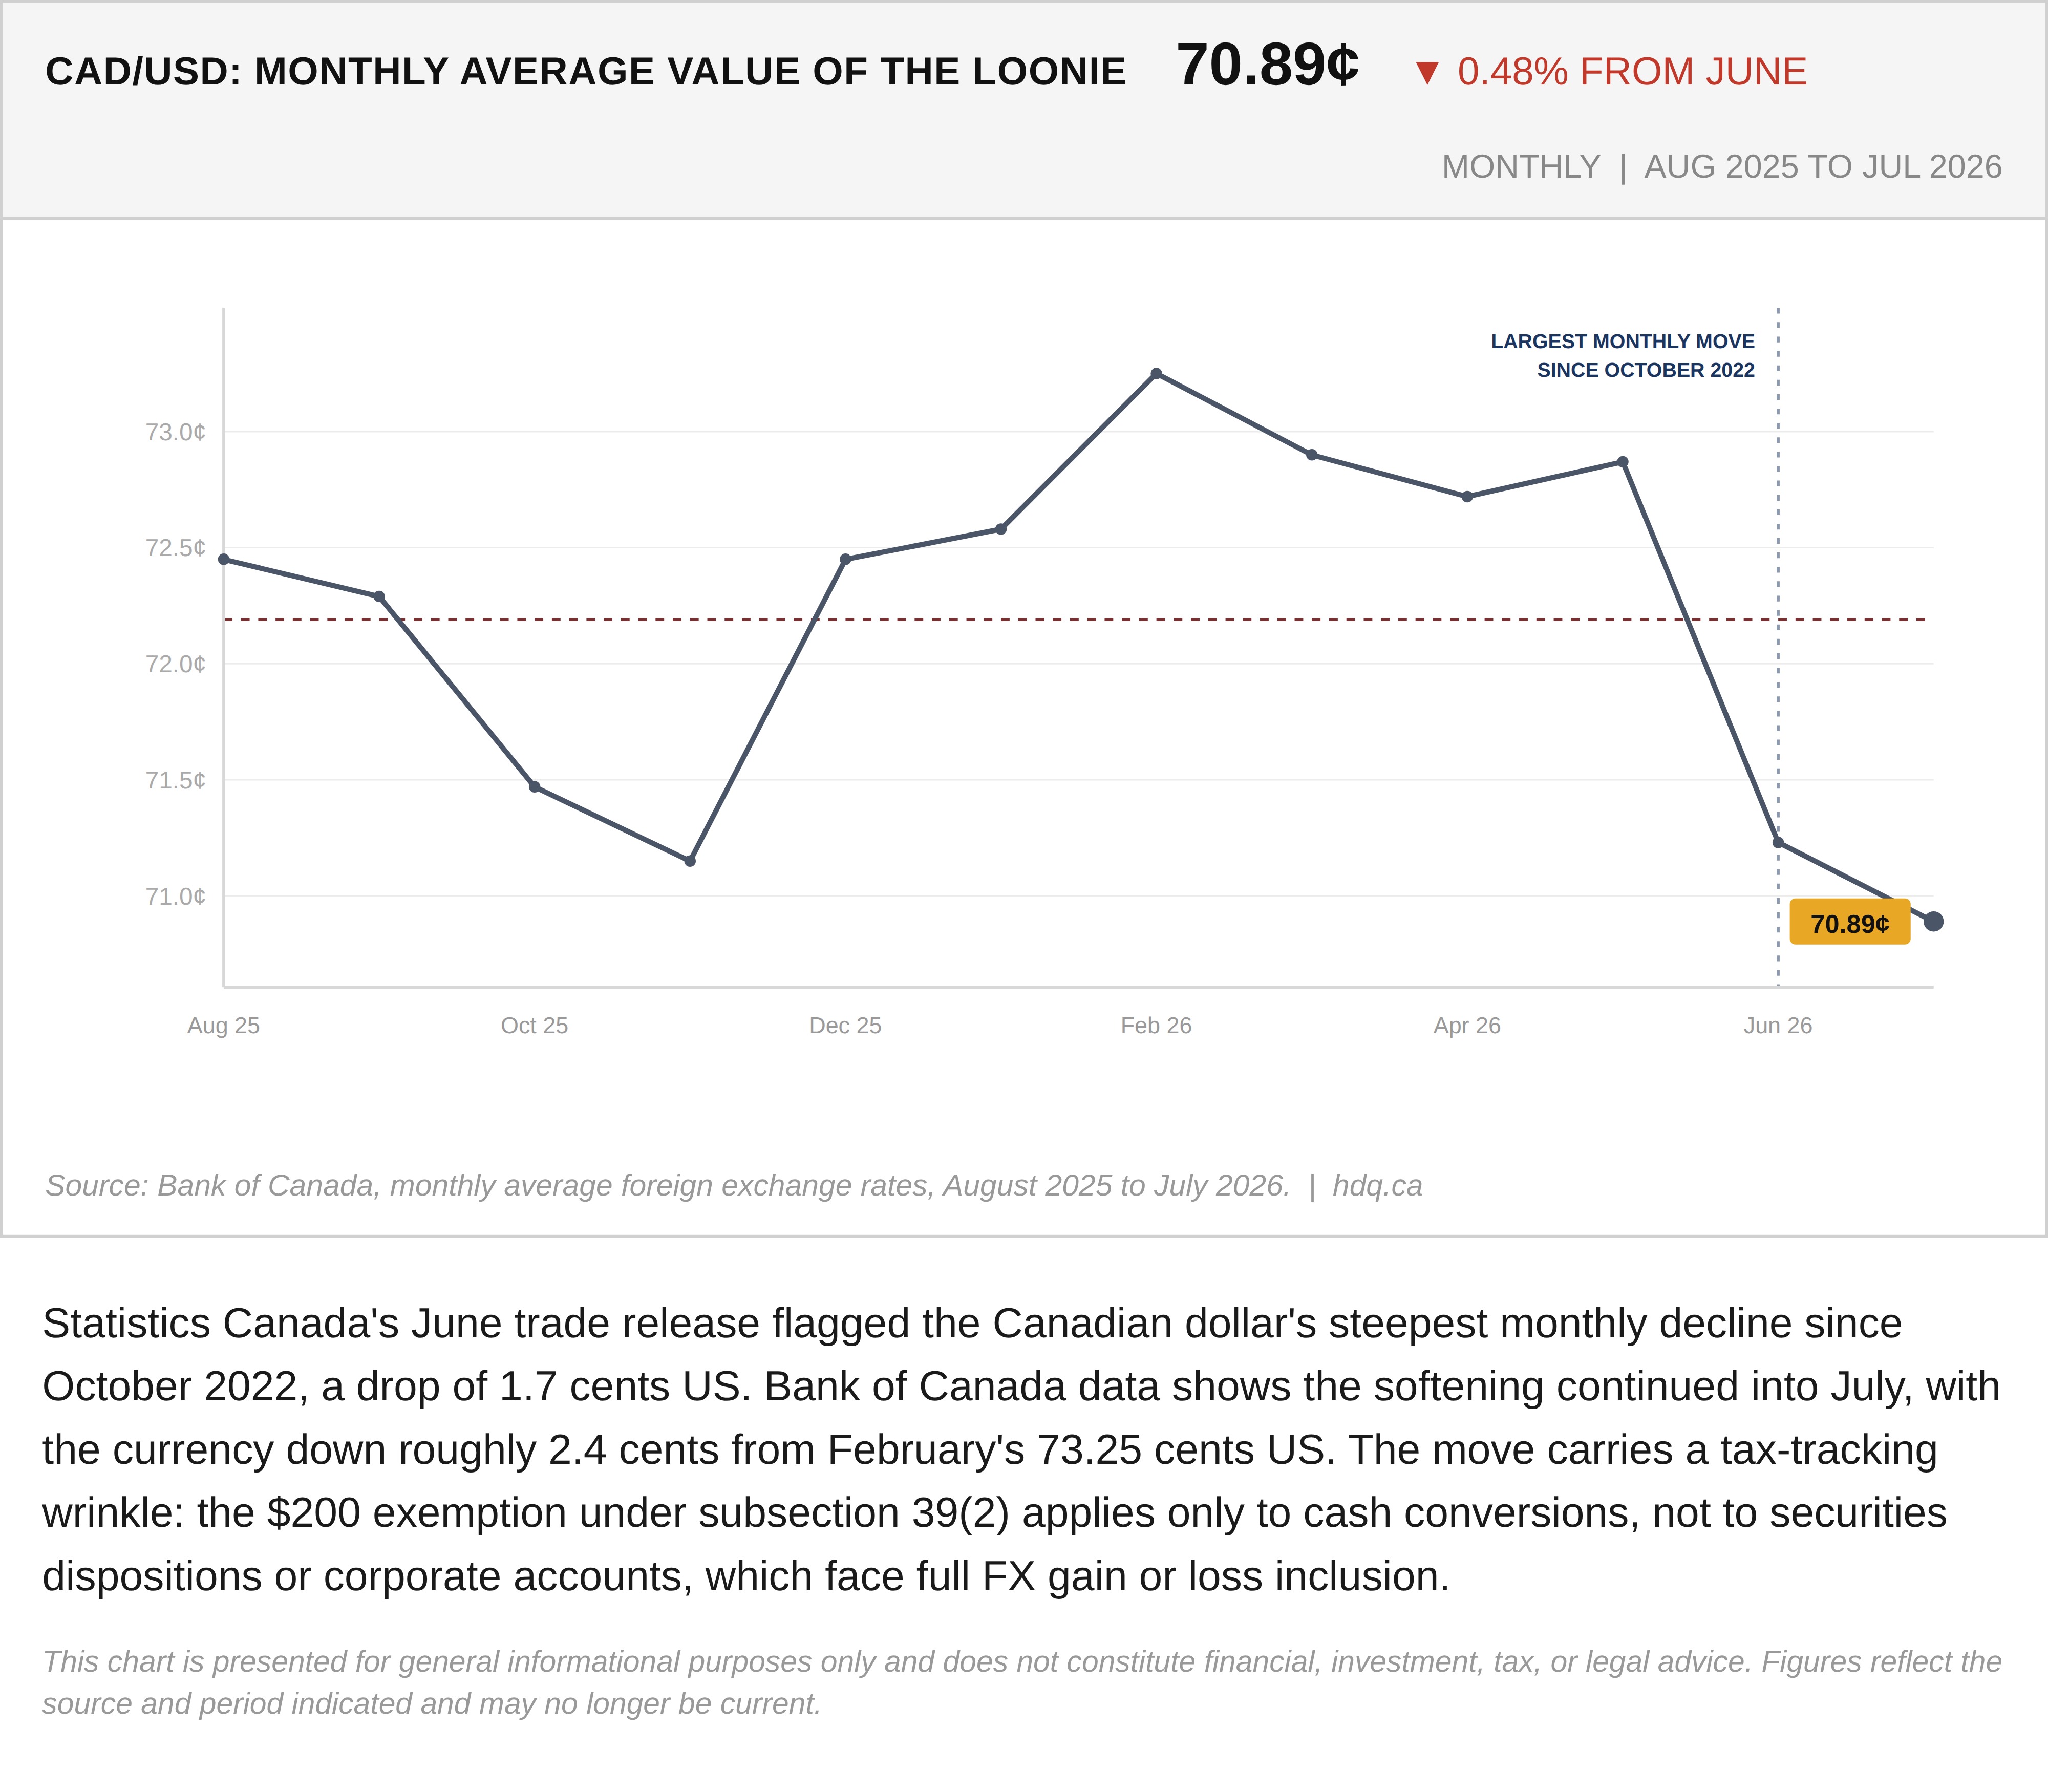
Statistics Canada's June trade release flagged the Canadian dollar's steepest monthly decline since October 2022, a drop of 1.7 cents US. Bank of Canada data shows the softening continued into July, with the currency down roughly 2.4 cents from February's 73.25 cents US. The move carries a tax-tracking wrinkle: the $200 exemption under subsection 39(2) applies only to cash conversions, not to securities dispositions or corporate accounts, which face full FX gain or loss inclusion.
This chart is presented for general informational purposes only and does not constitute financial, investment, tax, or legal advice. Figures reflect the source and period indicated and may no longer be current.
Related charts
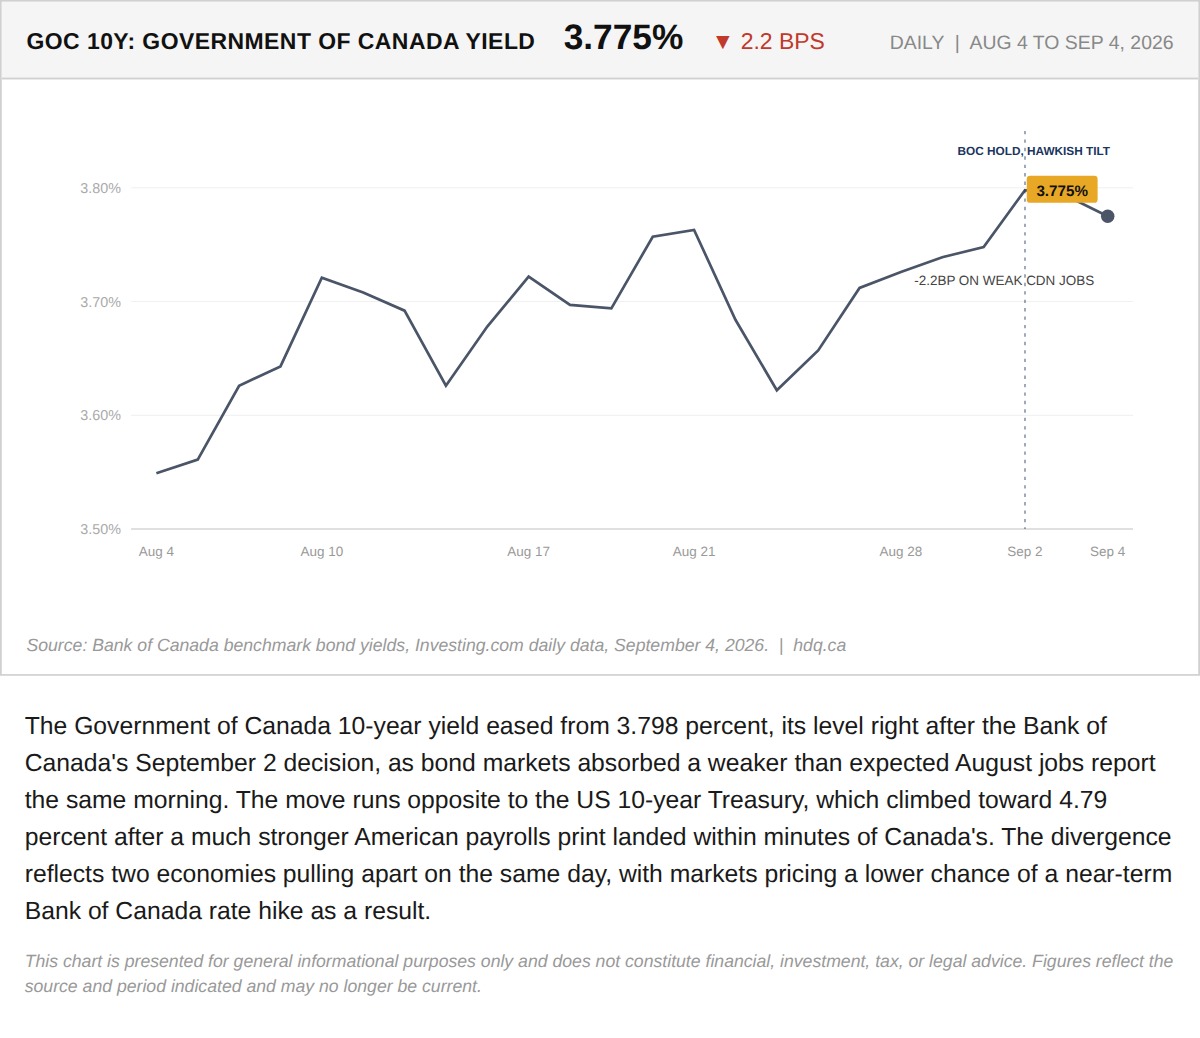
The Government of Canada 10-year yield eased from 3.798 percent, its level right after the Bank of Canada's September 2 decision, as bond…
Government of Canada 10-Year Yield Eases to 3.775% After August Jobs Miss
September 4, 2026
View chart & download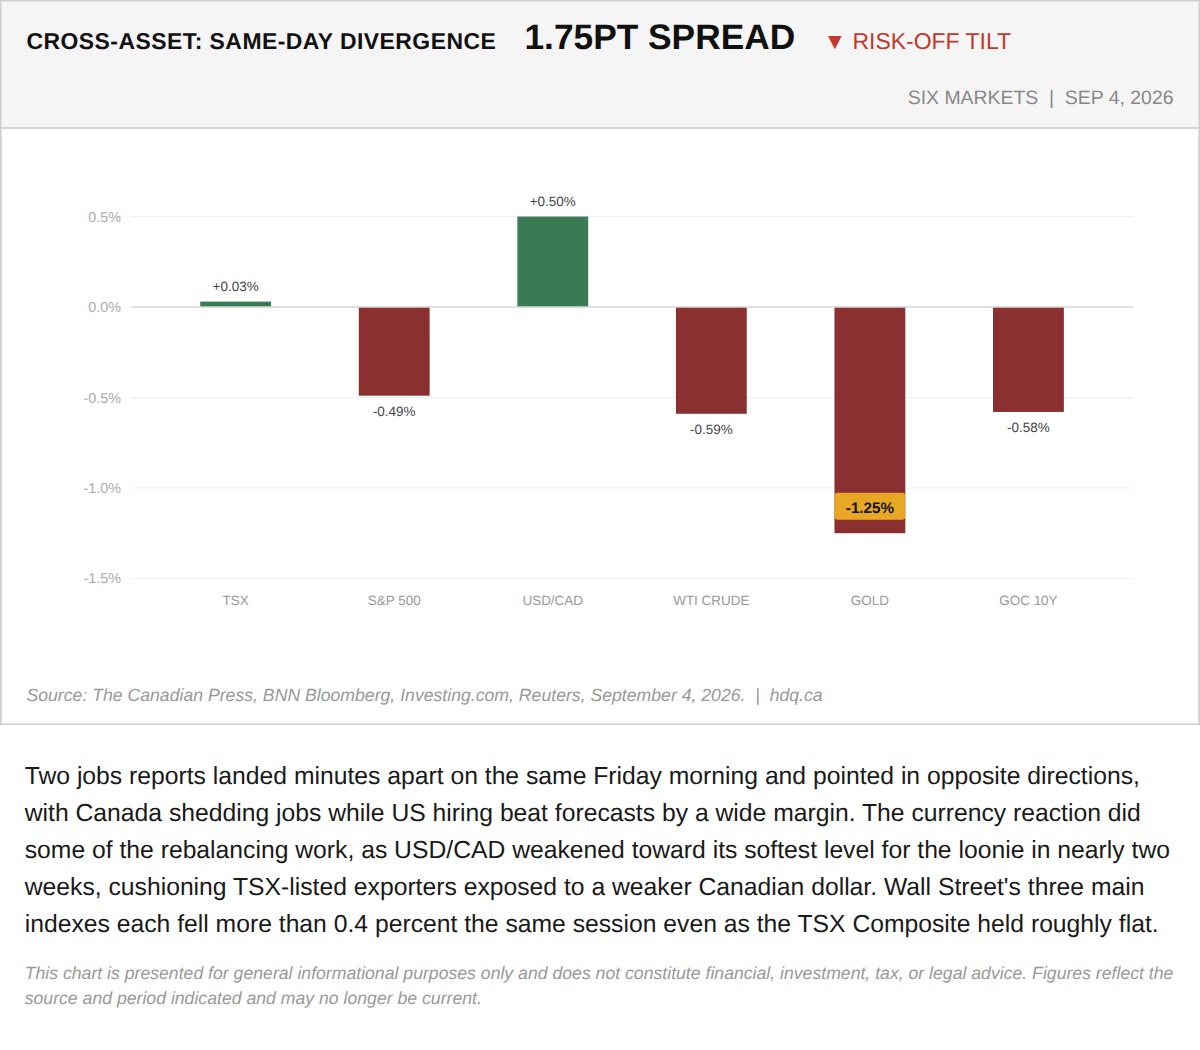
Two jobs reports landed minutes apart on the same Friday morning and pointed in opposite directions, with Canada shedding jobs while US hiring beat forecasts by a wide margin.
Six Markets Diverge in the Same Session as Canada and US Jobs Data Split
September 4, 2026
View chart & download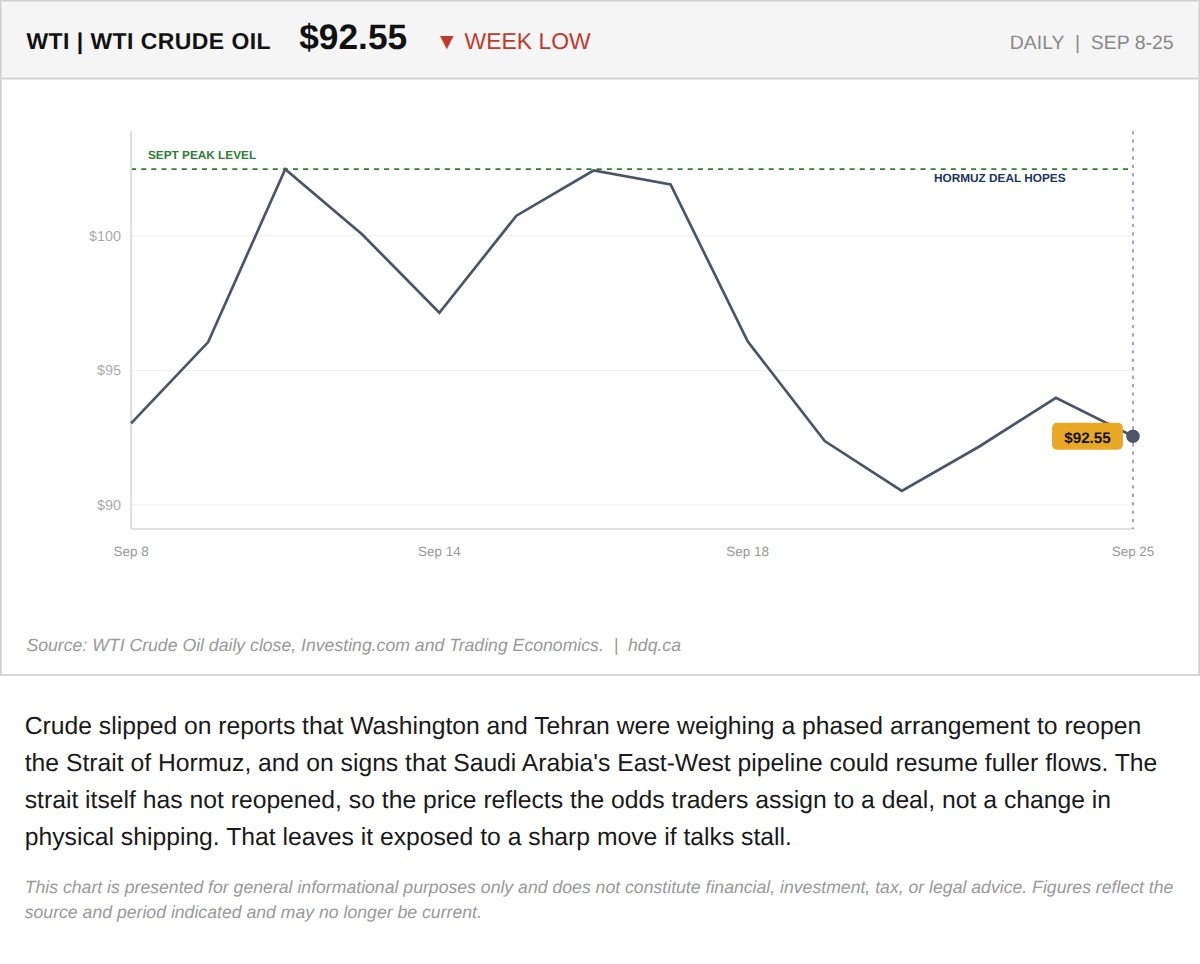
Crude slipped on reports that Washington and Tehran were weighing a phased arrangement to reopen the Strait of Hormuz, and on signs that…
WTI Crude Slips to a Weekly Low on Hormuz Deal Reports
September 25, 2026
View chart & download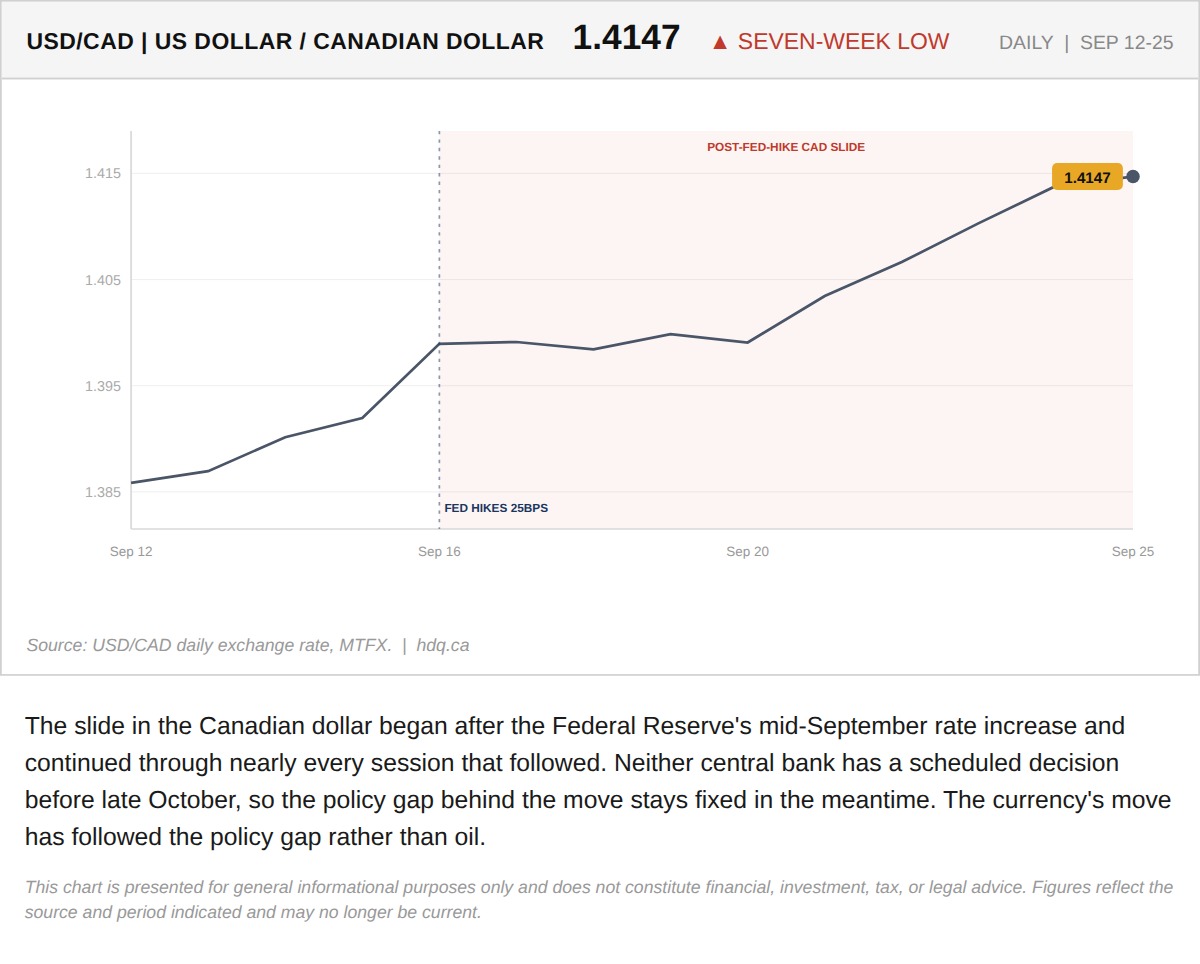
The slide in the Canadian dollar began after the Federal Reserve's mid-September rate increase and continued through nearly every session that followed.
USD/CAD Climbs to a Seven-Week High Since the Fed Hike
September 25, 2026
View chart & download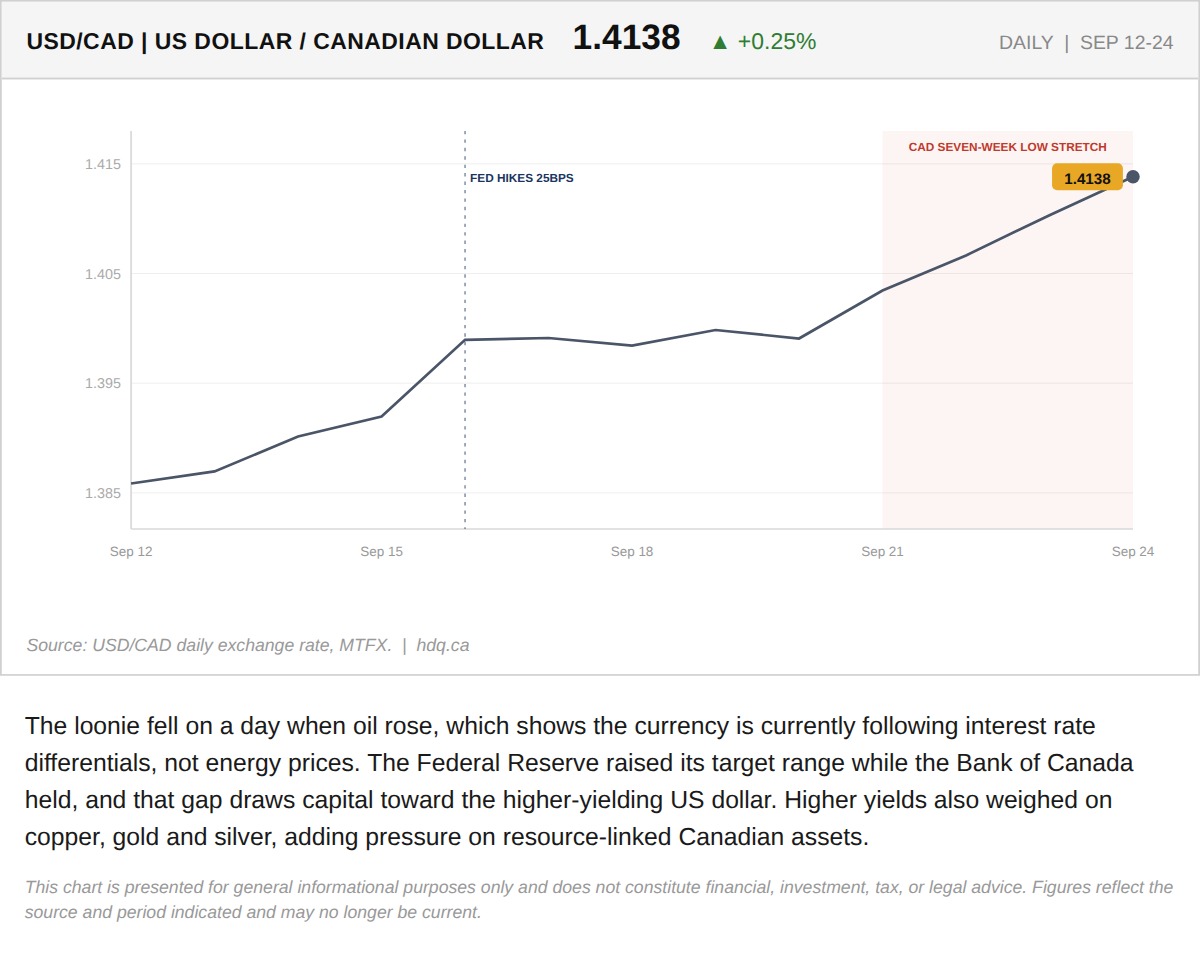
The loonie fell on a day when oil rose, which shows the currency is currently following interest rate differentials, not energy prices.
Canadian Dollar Weakens Even as Oil Rises
September 25, 2026
View chart & download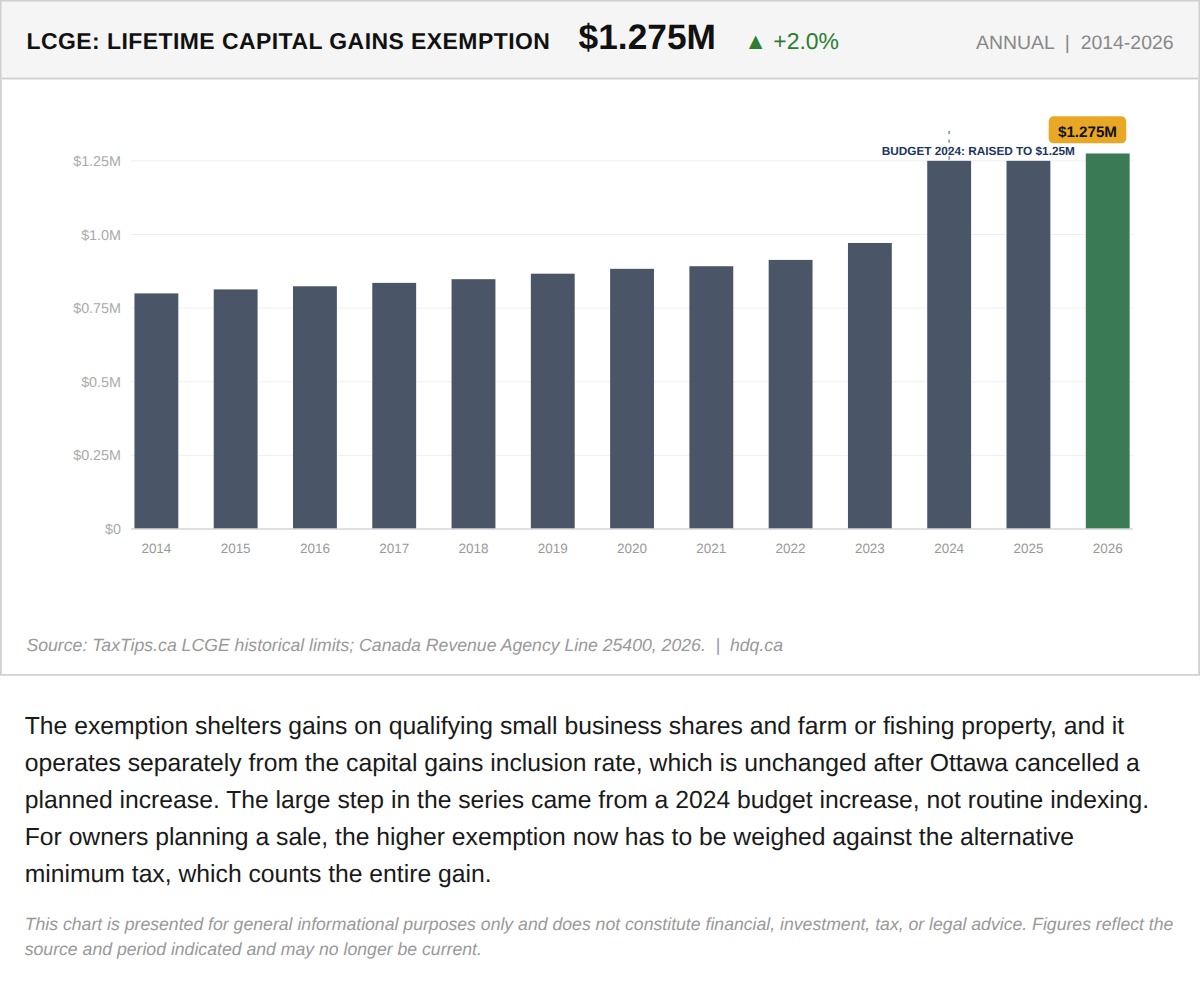
The exemption shelters gains on qualifying small business shares and farm or fishing property, and it operates separately from the capital…
Lifetime Capital Gains Exemption Climbs to $1.275 Million
September 24, 2026
View chart & download