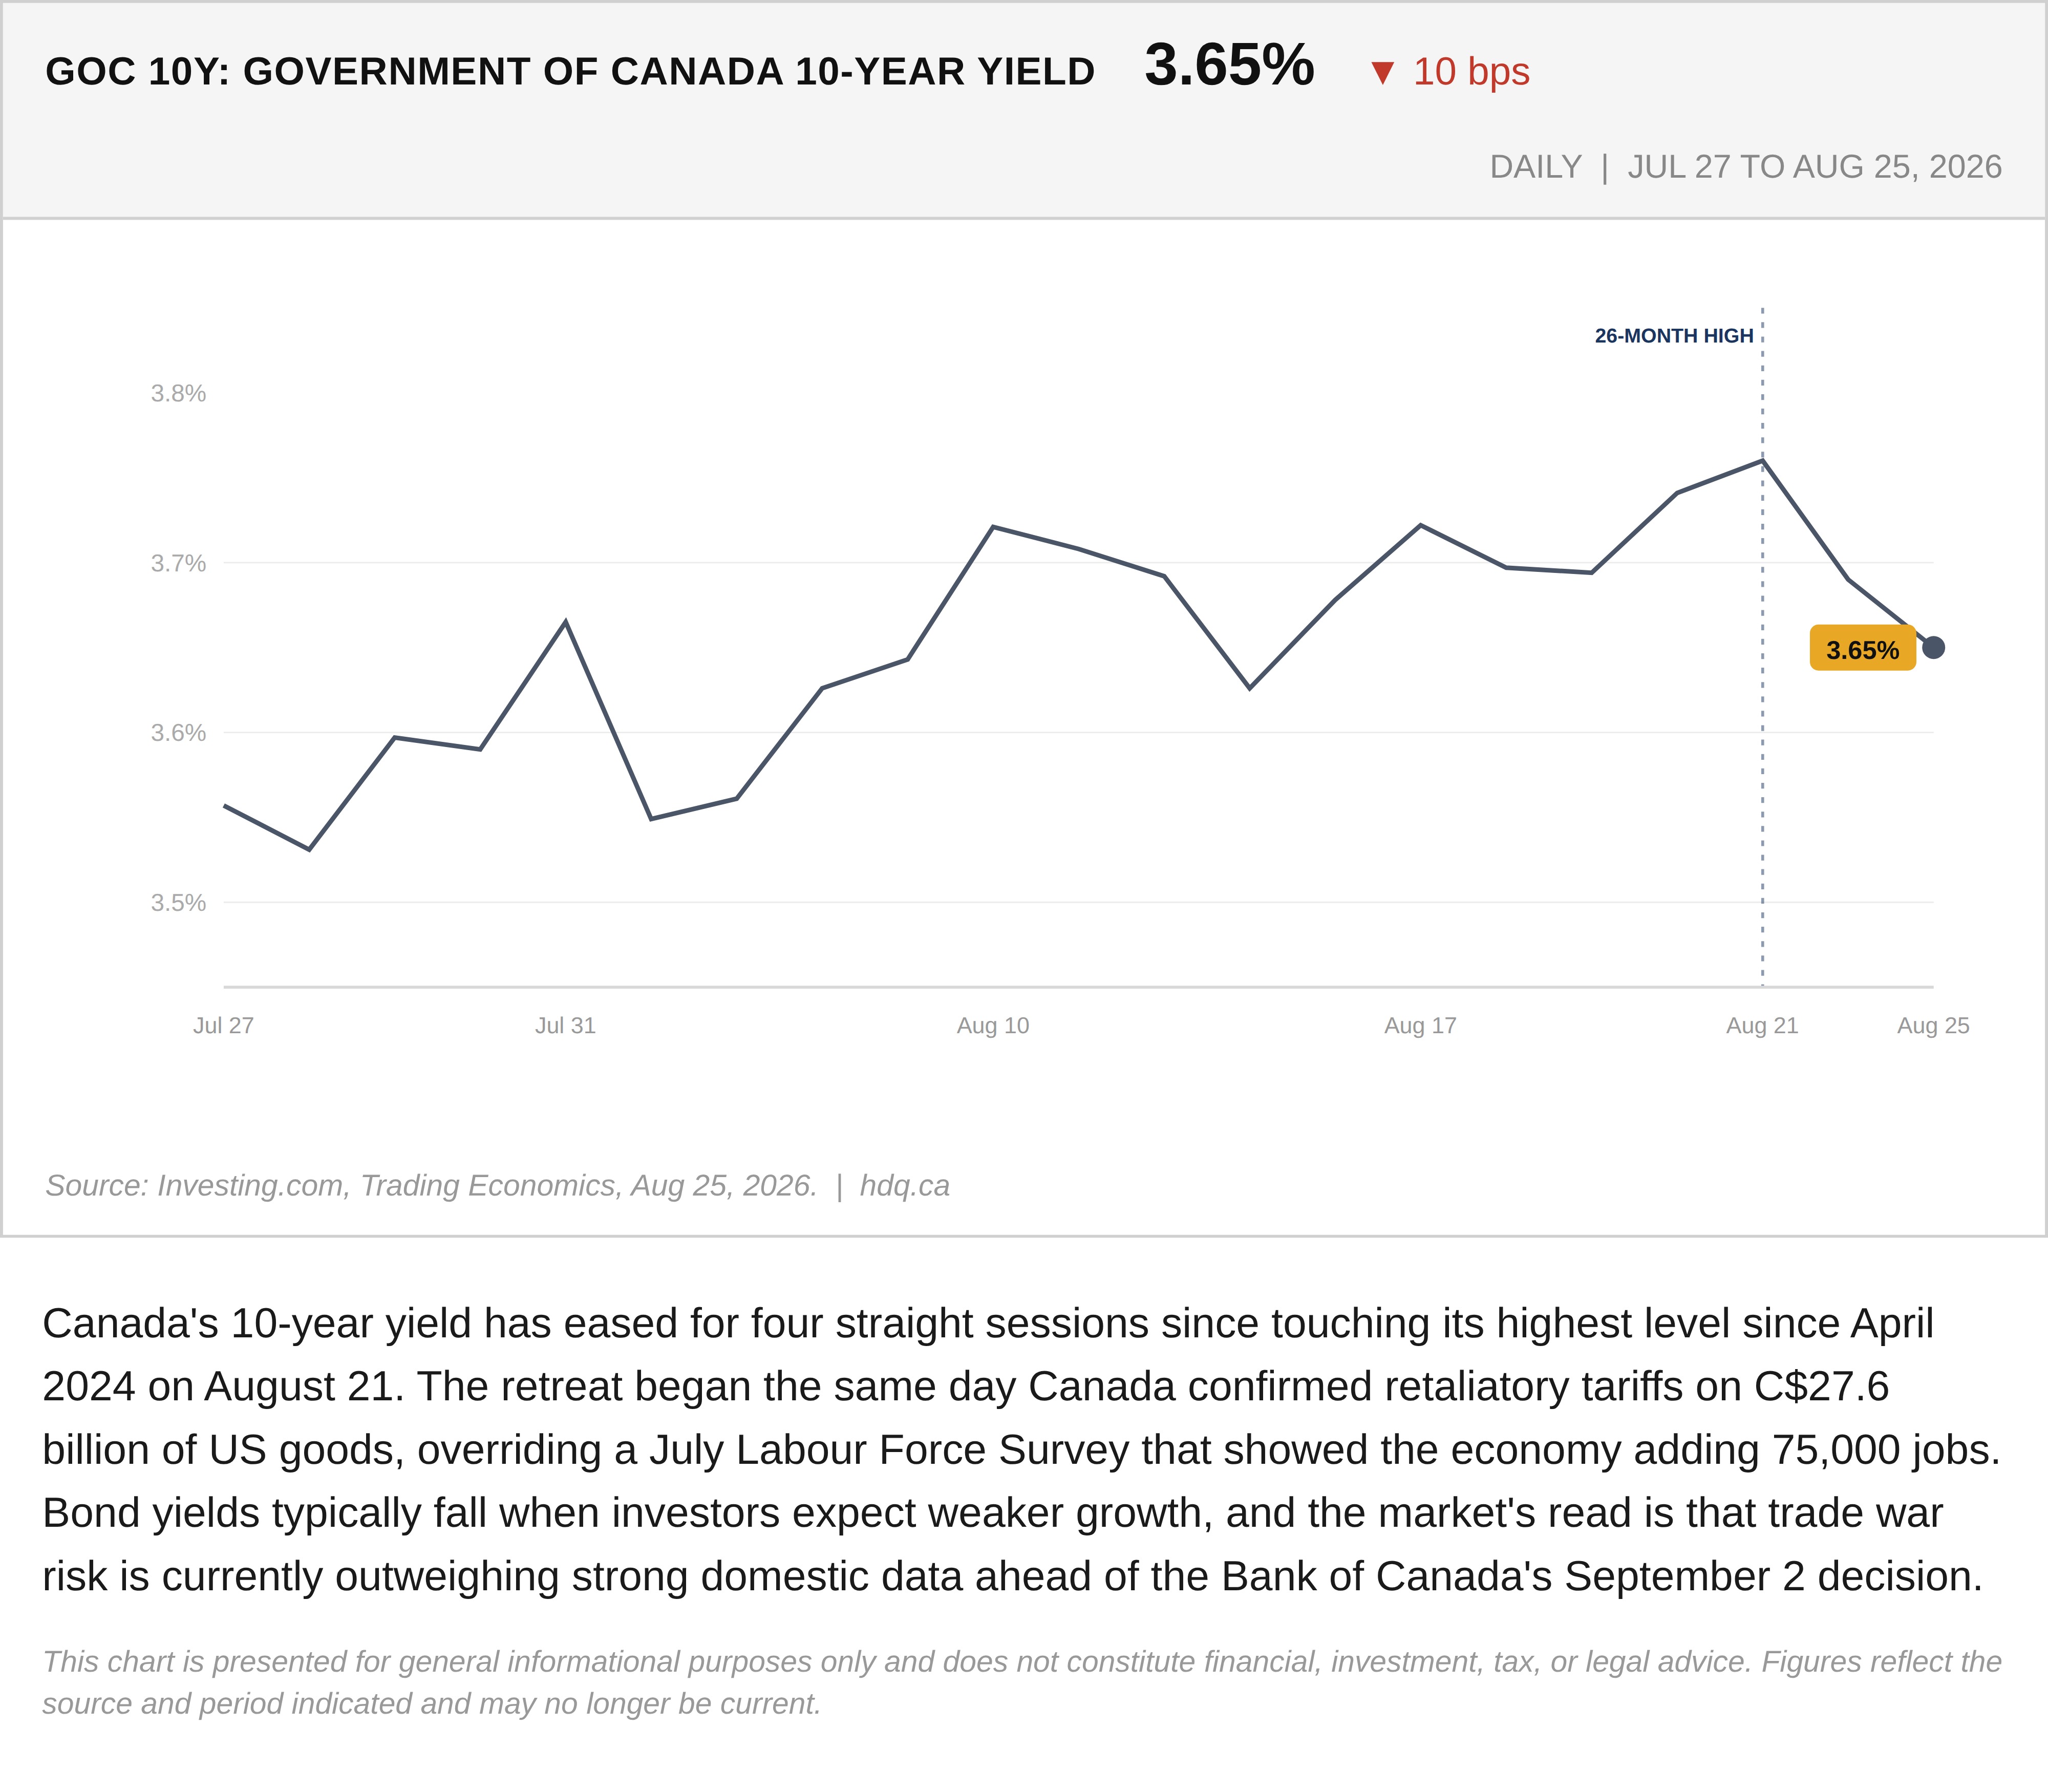
Canada's 10-year yield has eased for four straight sessions since touching its highest level since April 2024 on August 21. The retreat began the same day Canada confirmed retaliatory tariffs on C$27.6 billion of US goods, overriding a July Labour Force Survey that showed the economy adding 75,000 jobs. Bond yields typically fall when investors expect weaker growth, and the market's read is that trade war risk is currently outweighing strong domestic data ahead of the Bank of Canada's September 2 decision.
This chart is presented for general informational purposes only and does not constitute financial, investment, tax, or legal advice. Figures reflect the source and period indicated and may no longer be current.
Related charts
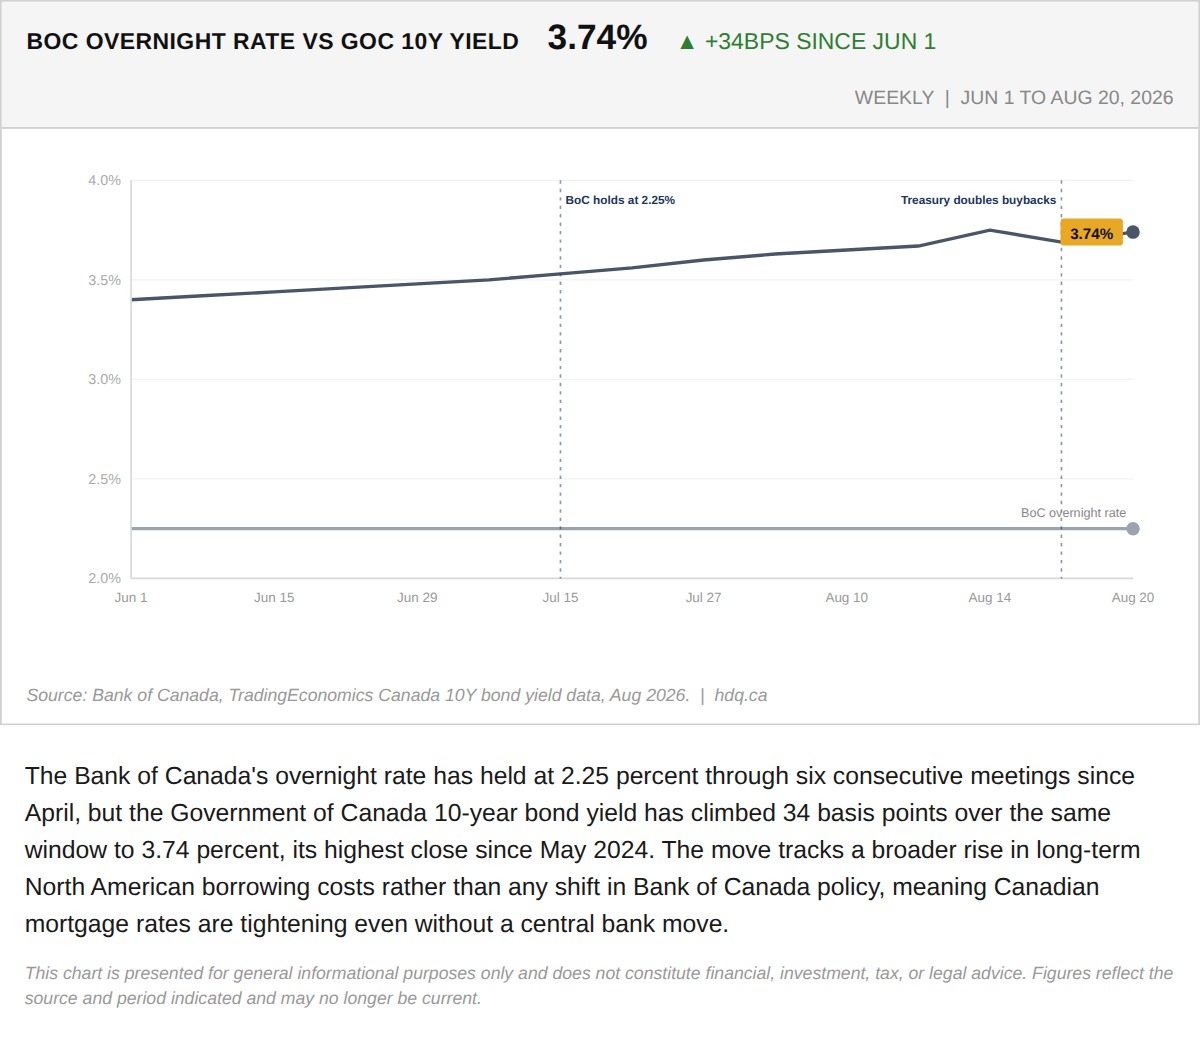
The Bank of Canada's overnight rate has held at 2.25 percent through six consecutive meetings since April, but the Government of Canada…
Government of Canada 10-Year Yield Climbs 34bps While BoC Rate Stays Put
August 21, 2026
View chart & download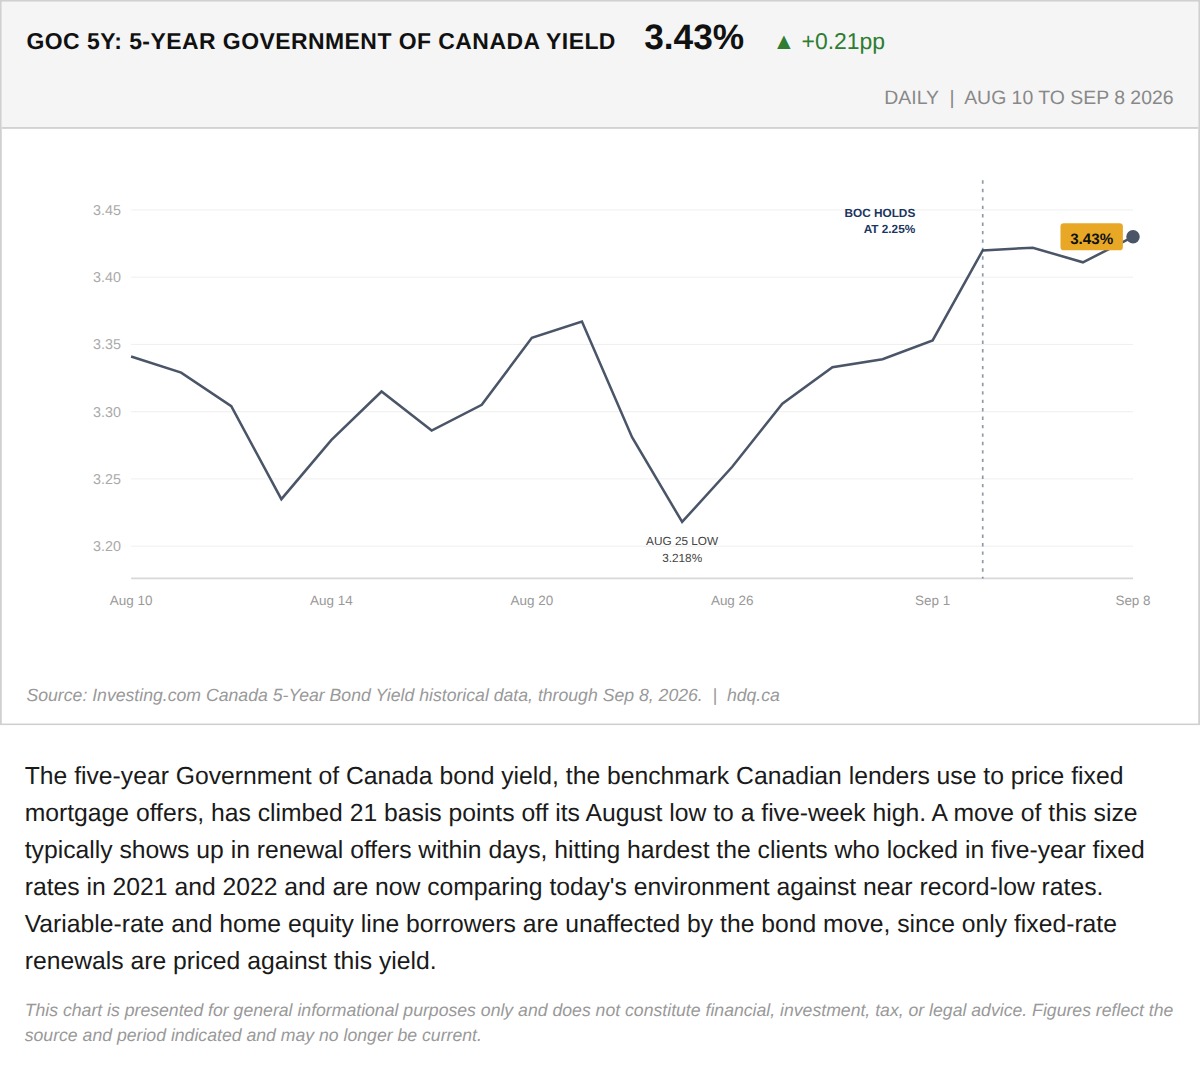
The five-year Government of Canada bond yield, the benchmark Canadian lenders use to price fixed mortgage offers, has climbed 21 basis points off its August low to a five-week high.
The Bond Market Just Handed 2026 Mortgage Renewals a Harder Number
September 14, 2026
View chart & download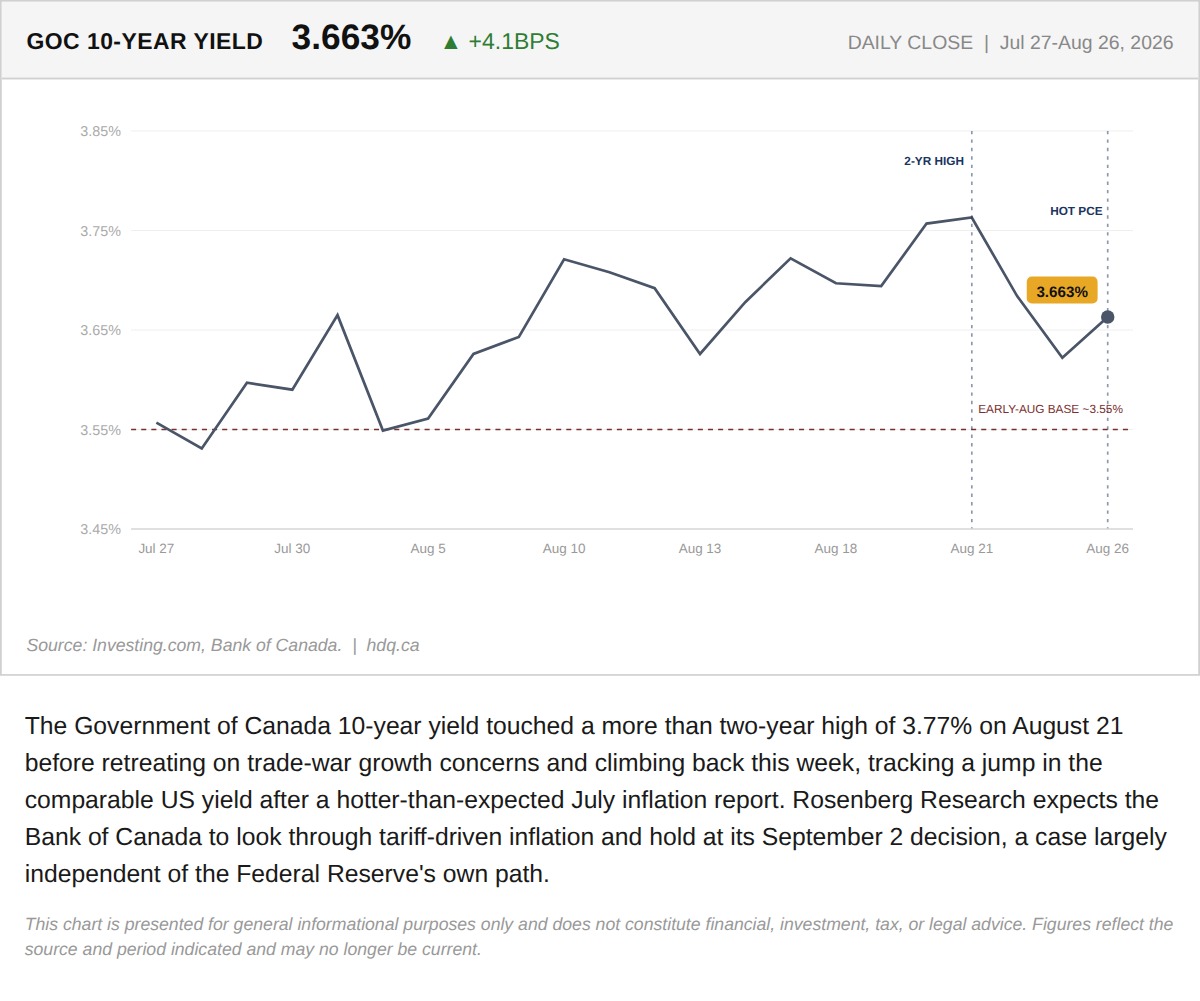
The Government of Canada 10-year yield touched a more than two-year high of 3.77% on August 21 before retreating on trade-war growth…
The 10-Year Round Trip: What a Hot PCE Print Means for the Sept. 2 BoC Decision
August 27, 2026
View chart & download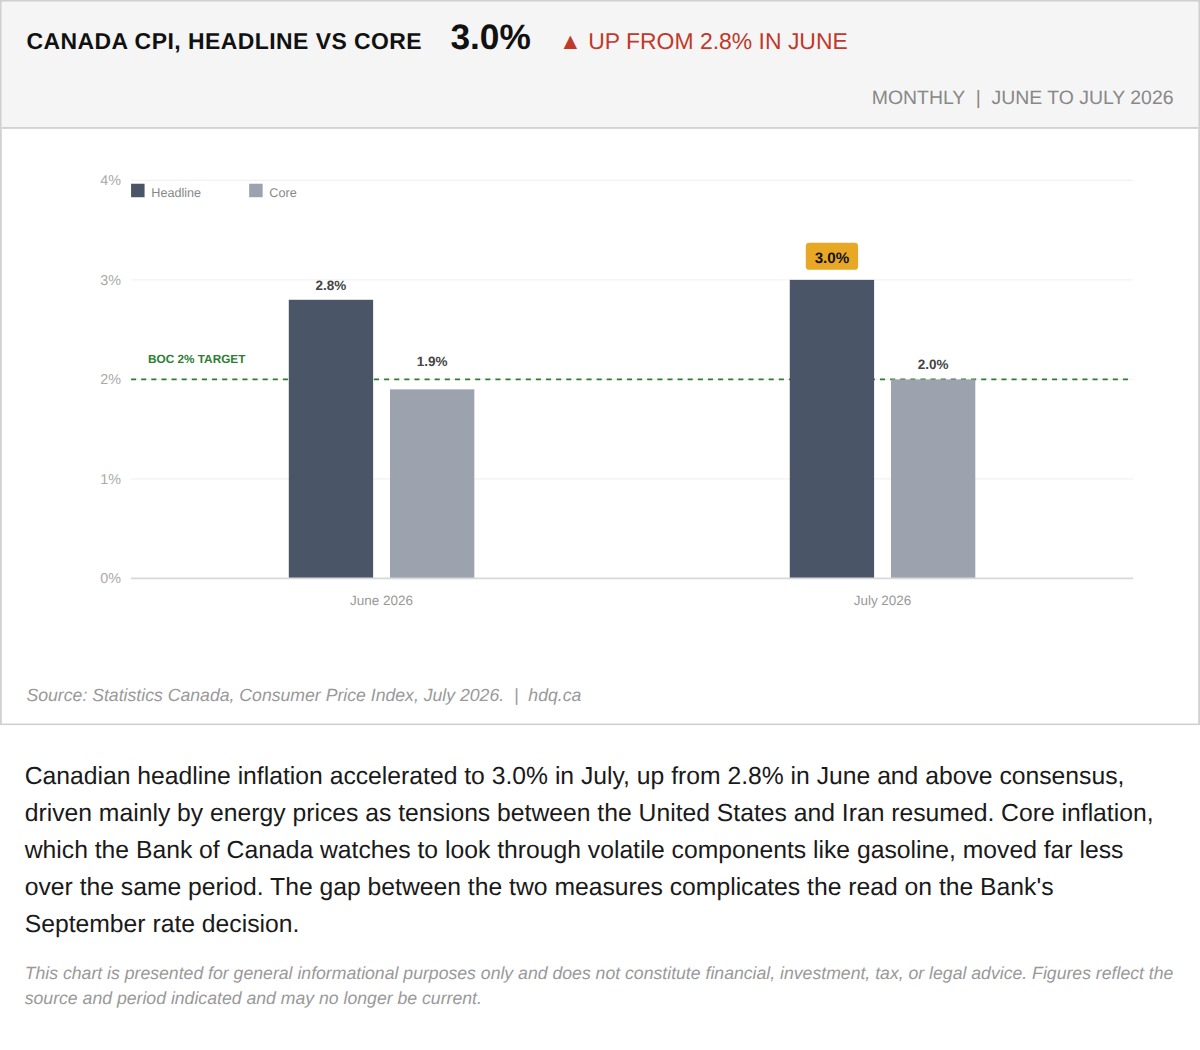
Canadian headline inflation accelerated to 3.0% in July, up from 2.8% in June and above consensus, driven mainly by energy prices as…
August 20, 2026
View chart & download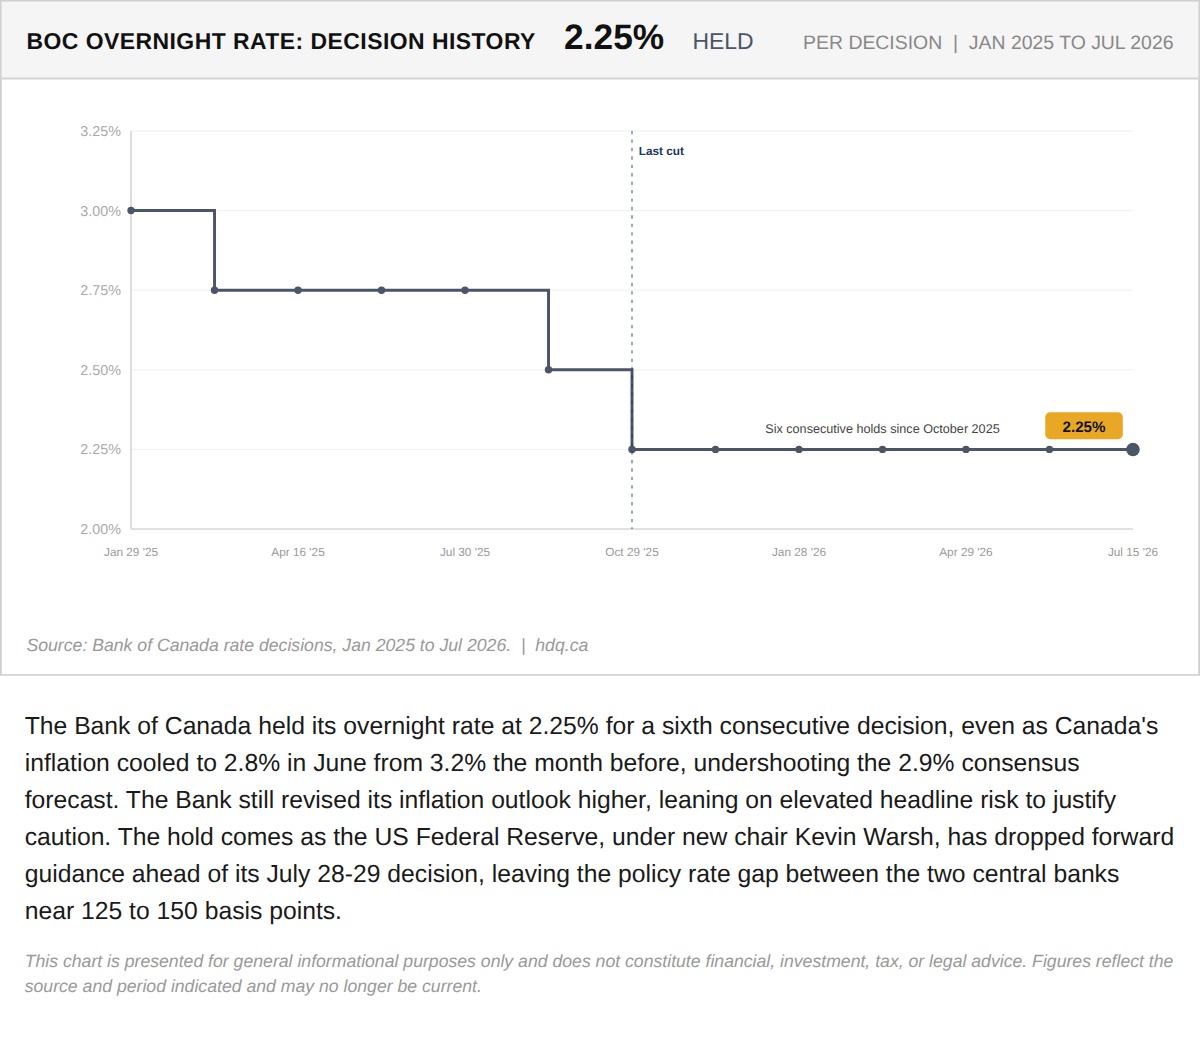
The Bank of Canada held its overnight rate at 2.25% for a sixth consecutive decision, even as Canada's inflation cooled to 2.8% in June…
Canada's Inflation Cooled to 2.8%. The Bank of Canada Got More Hawkish Anyway.
July 22, 2026
View chart & download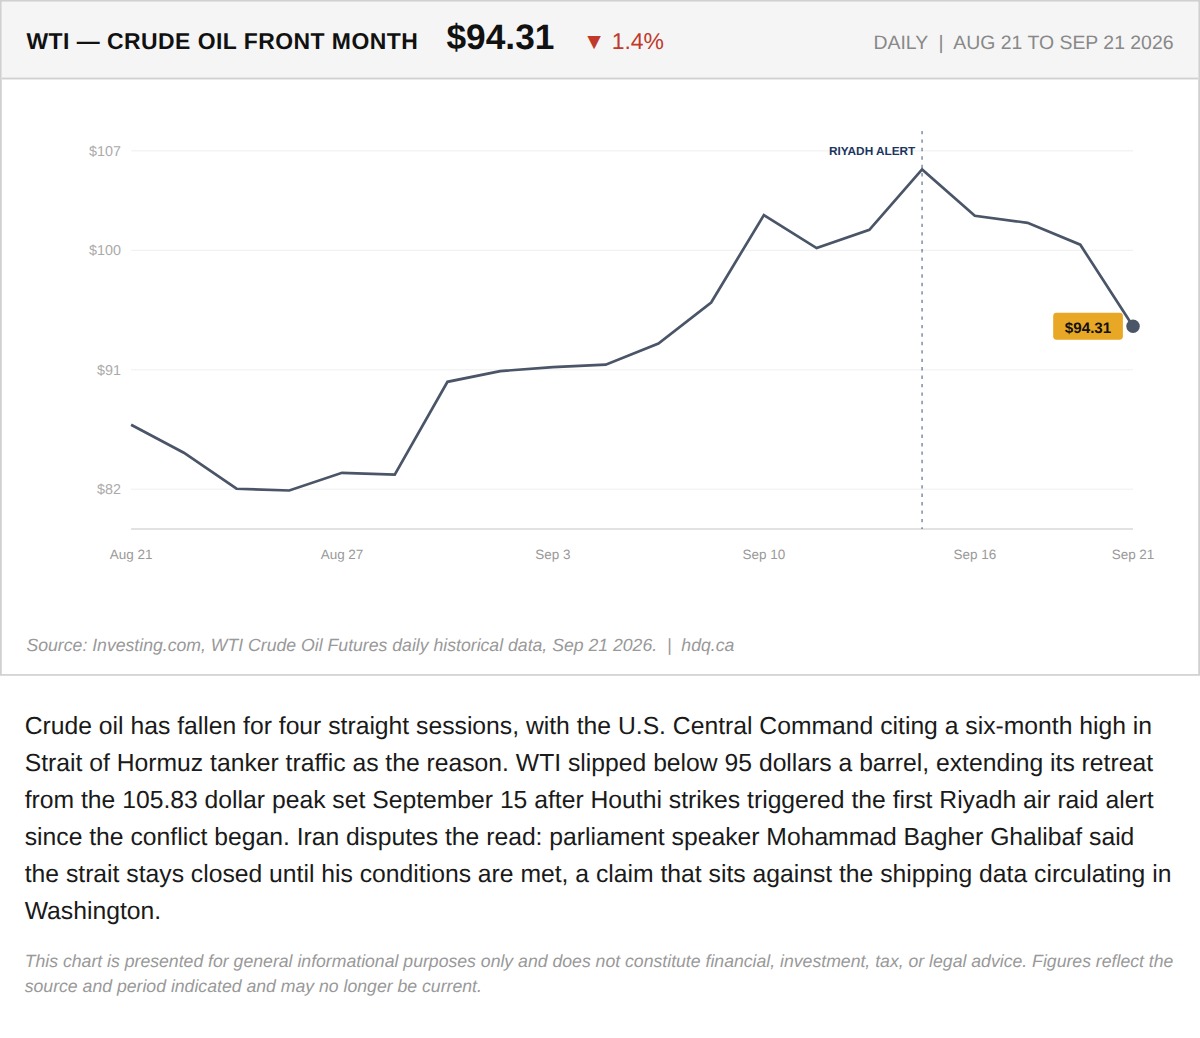
Crude oil has fallen for four straight sessions, with the U.S.
Oil Falls for a Fourth Session as Hormuz Shipping Data Is Disputed
September 21, 2026
View chart & download