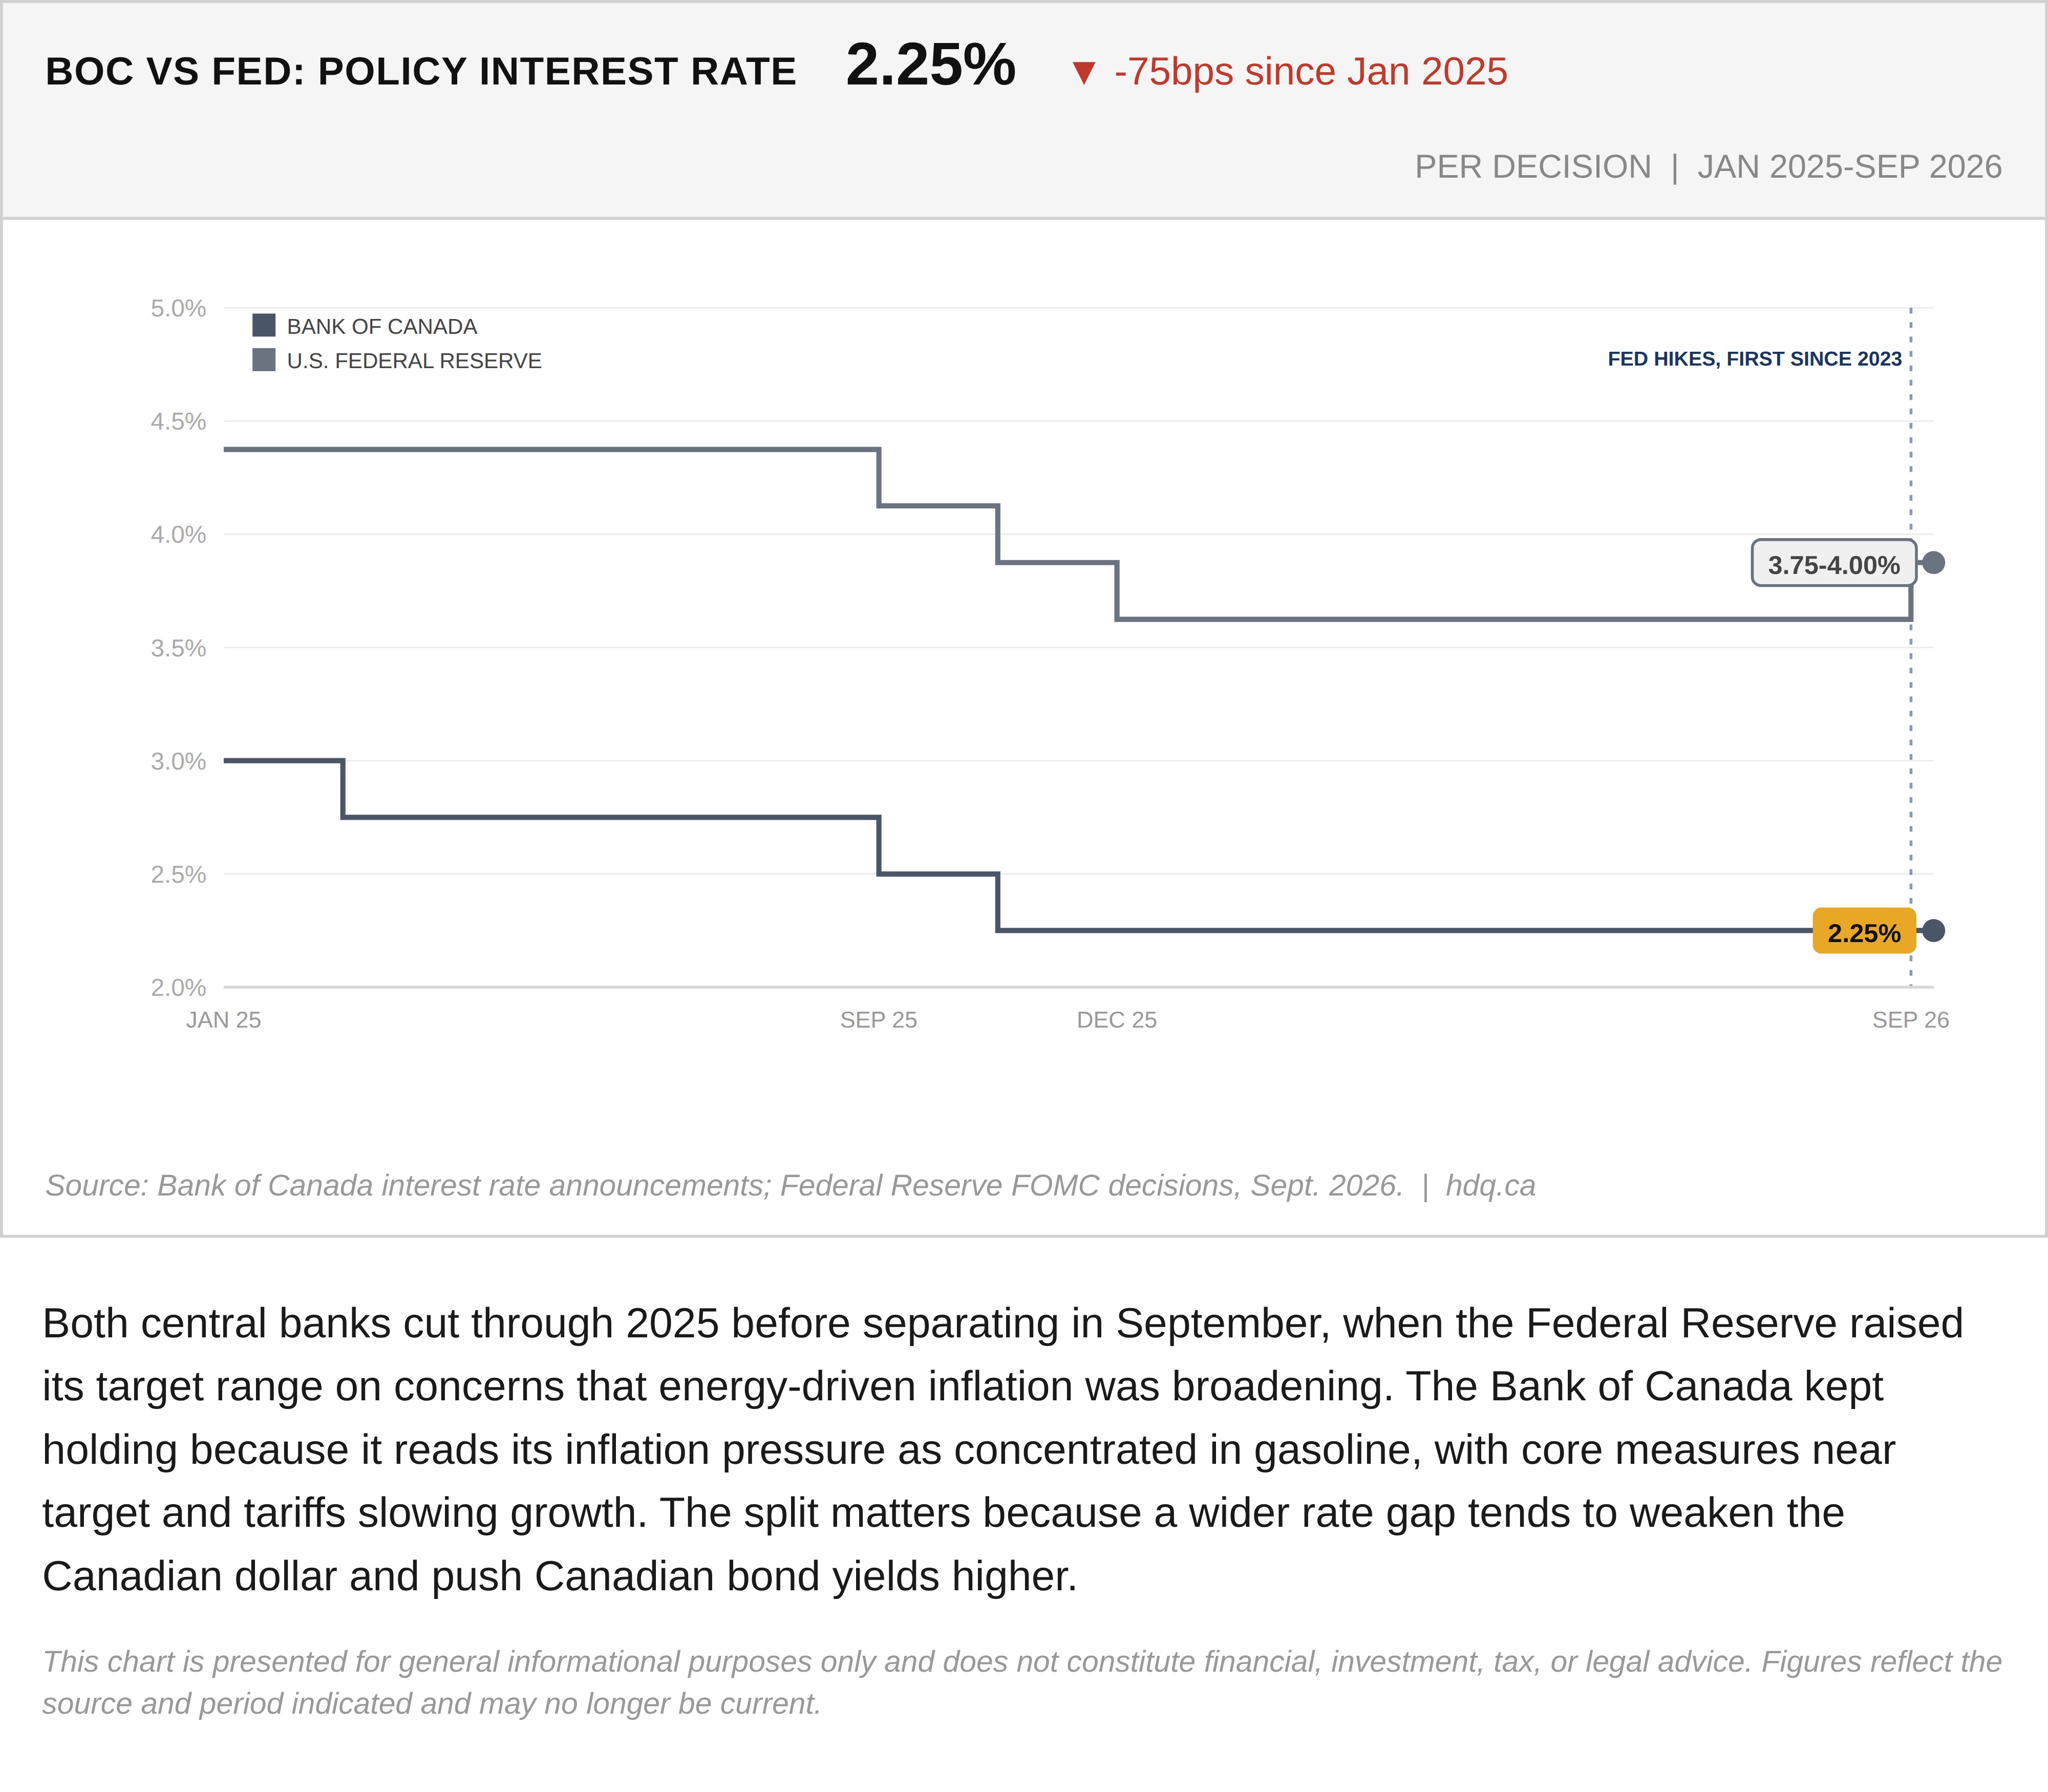
Both central banks cut through 2025 before separating in September, when the Federal Reserve raised its target range on concerns that energy-driven inflation was broadening. The Bank of Canada kept holding because it reads its inflation pressure as concentrated in gasoline, with core measures near target and tariffs slowing growth. The split matters because a wider rate gap tends to weaken the Canadian dollar and push Canadian bond yields higher.
This chart is presented for general informational purposes only and does not constitute financial, investment, tax, or legal advice. Figures reflect the source and period indicated and may no longer be current.
Related charts
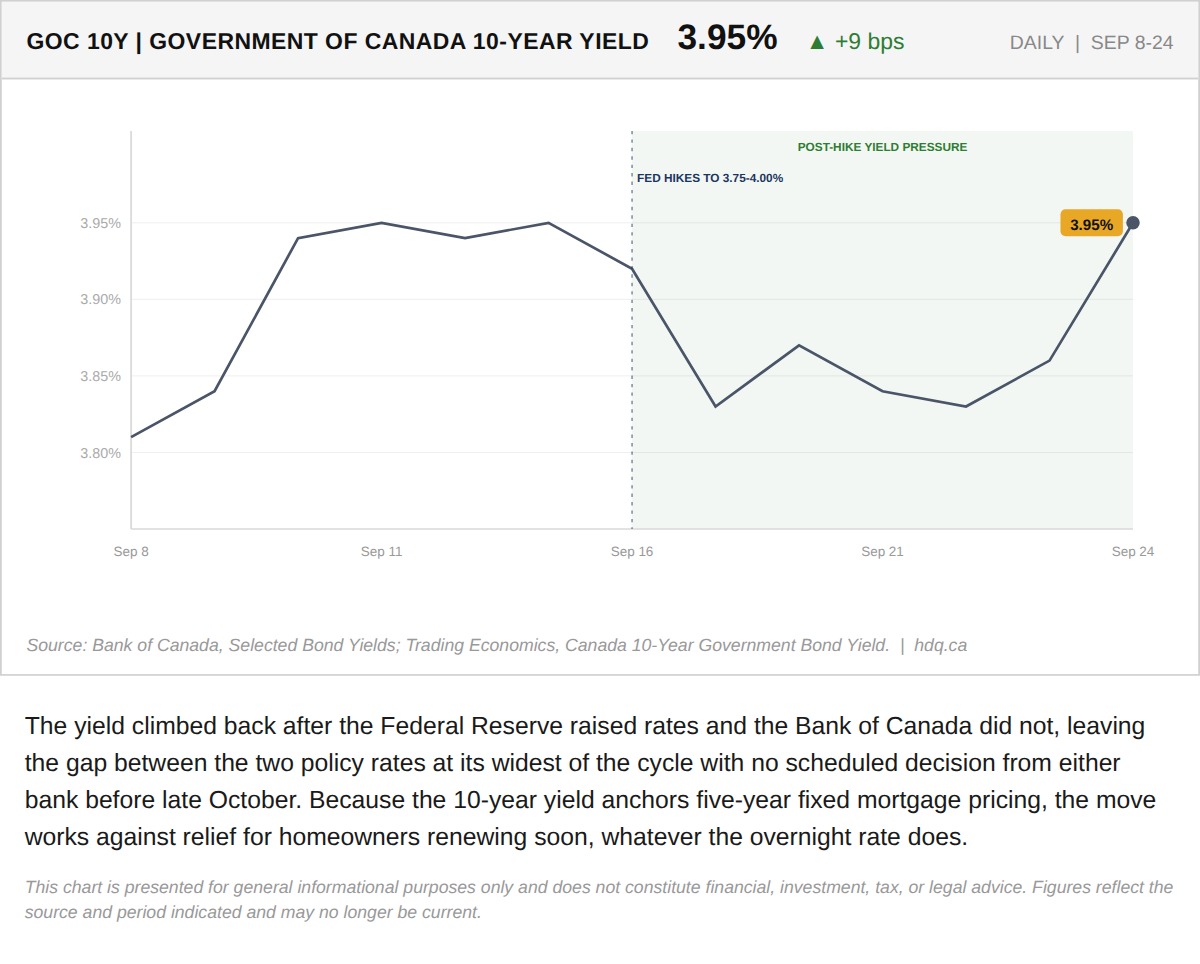
The yield climbed back after the Federal Reserve raised rates and the Bank of Canada did not, leaving the gap between the two policy rates…
Canada 10-Year Bond Yield Returns to Its September High
September 25, 2026
View chart & download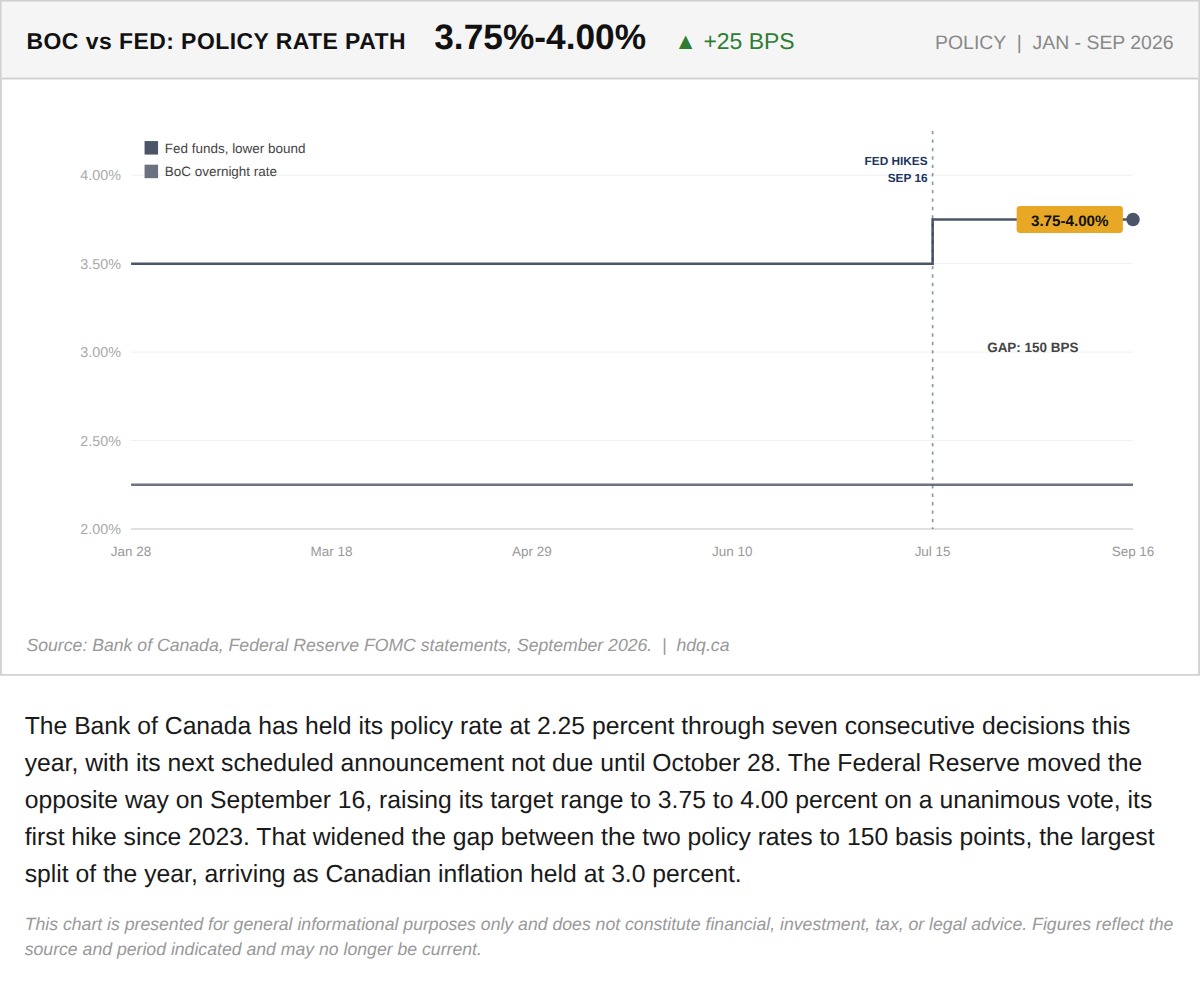
The Bank of Canada has held its policy rate at 2.25 percent through seven consecutive decisions this year, with its next scheduled announcement not due until October 28.
The Bank of Canada Has Not Moved All Year. The Fed Just Did.
September 18, 2026
View chart & download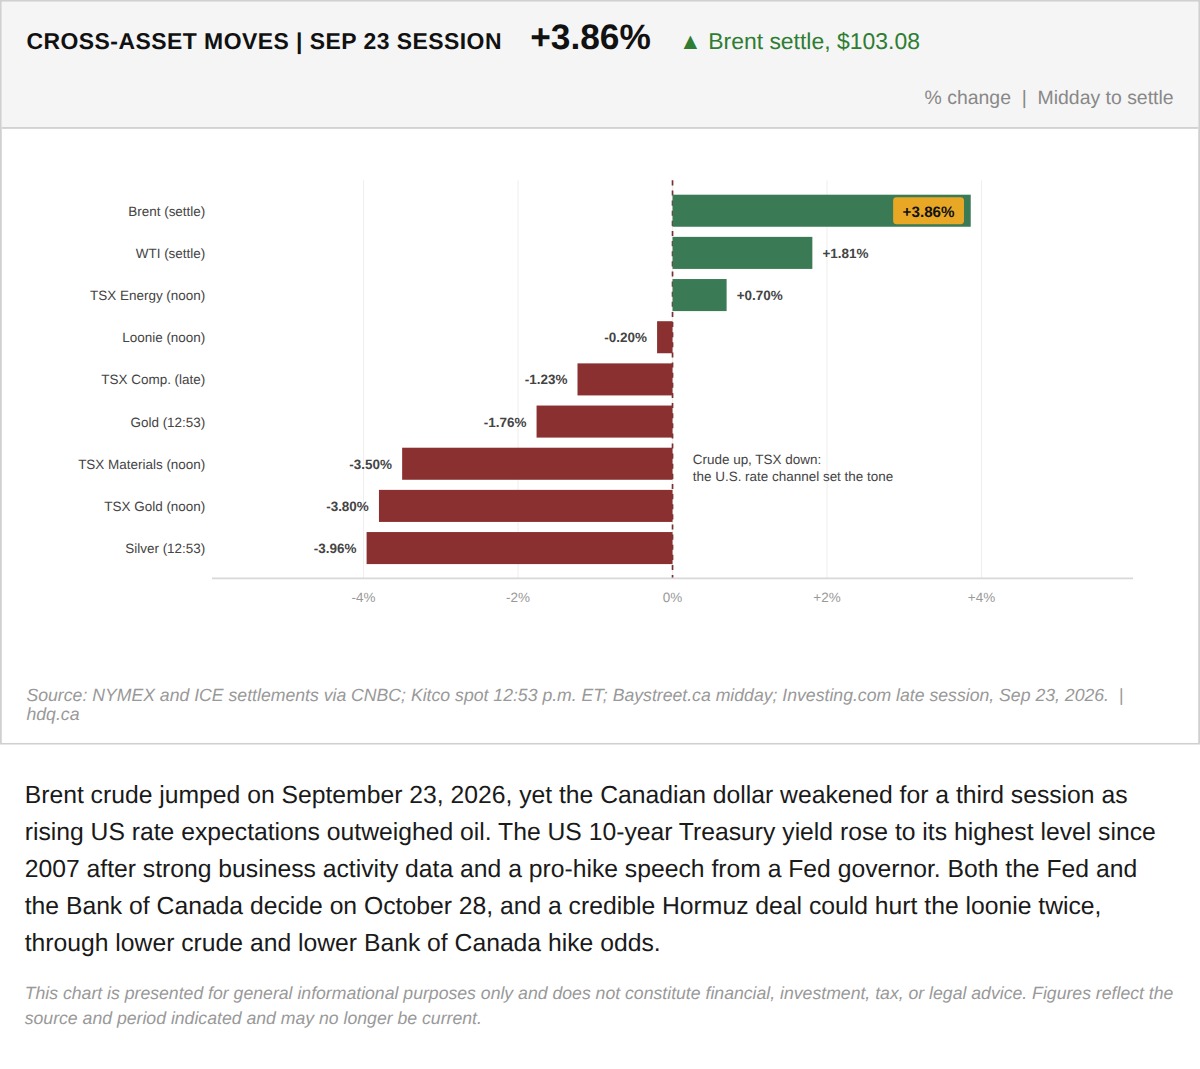
Brent crude jumped on September 23, 2026, yet the Canadian dollar weakened for a third session as rising US rate expectations outweighed oil.
Brent Jumps While the Canadian Dollar and TSX Fall in the September 23 Session
September 23, 2026
View chart & download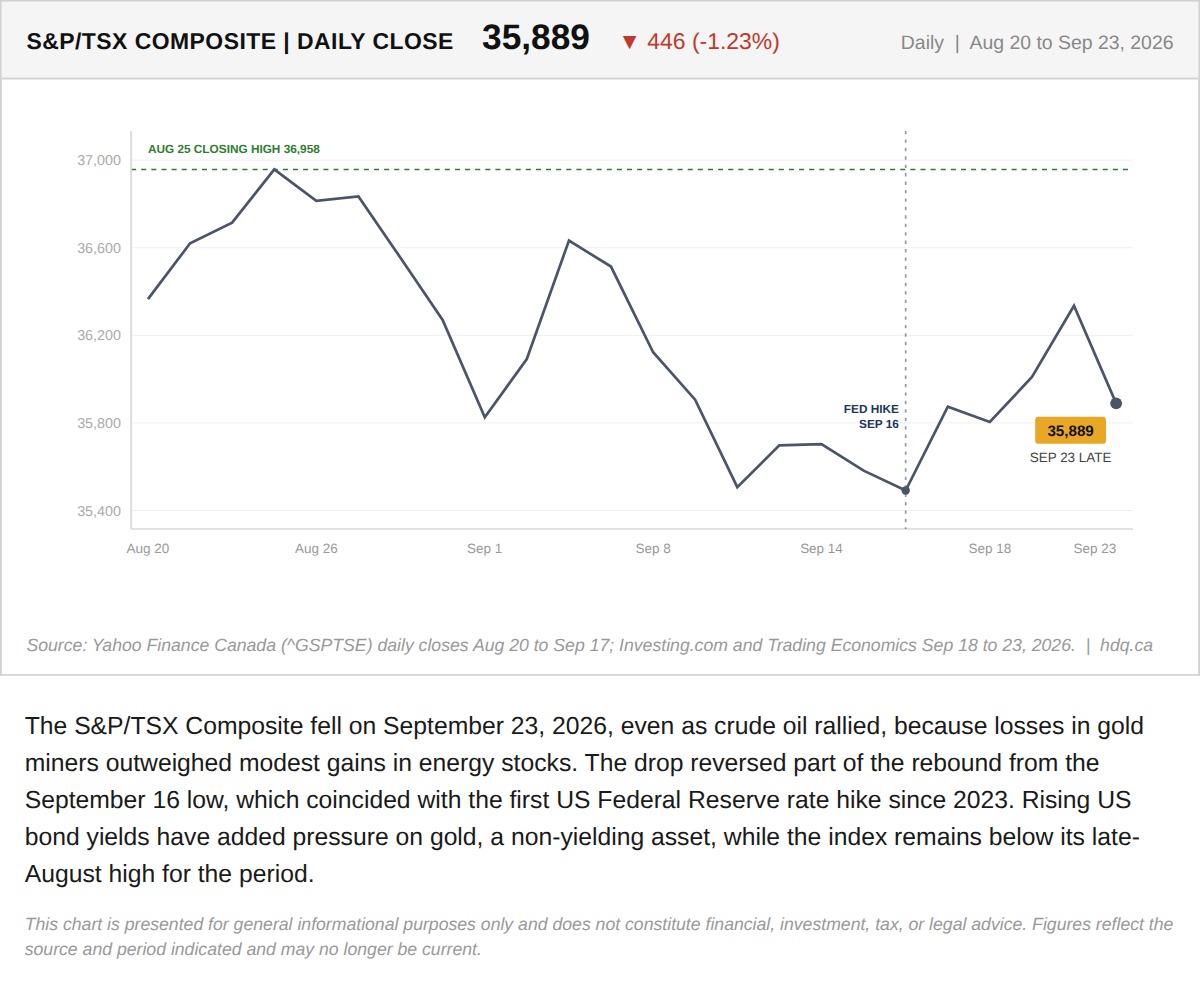
The S&P/TSX Composite fell on September 23, 2026, even as crude oil rallied, because losses in gold miners outweighed modest gains in energy stocks.
TSX Composite Falls Despite an Oil Rally as Gold Stocks Slide
September 23, 2026
View chart & download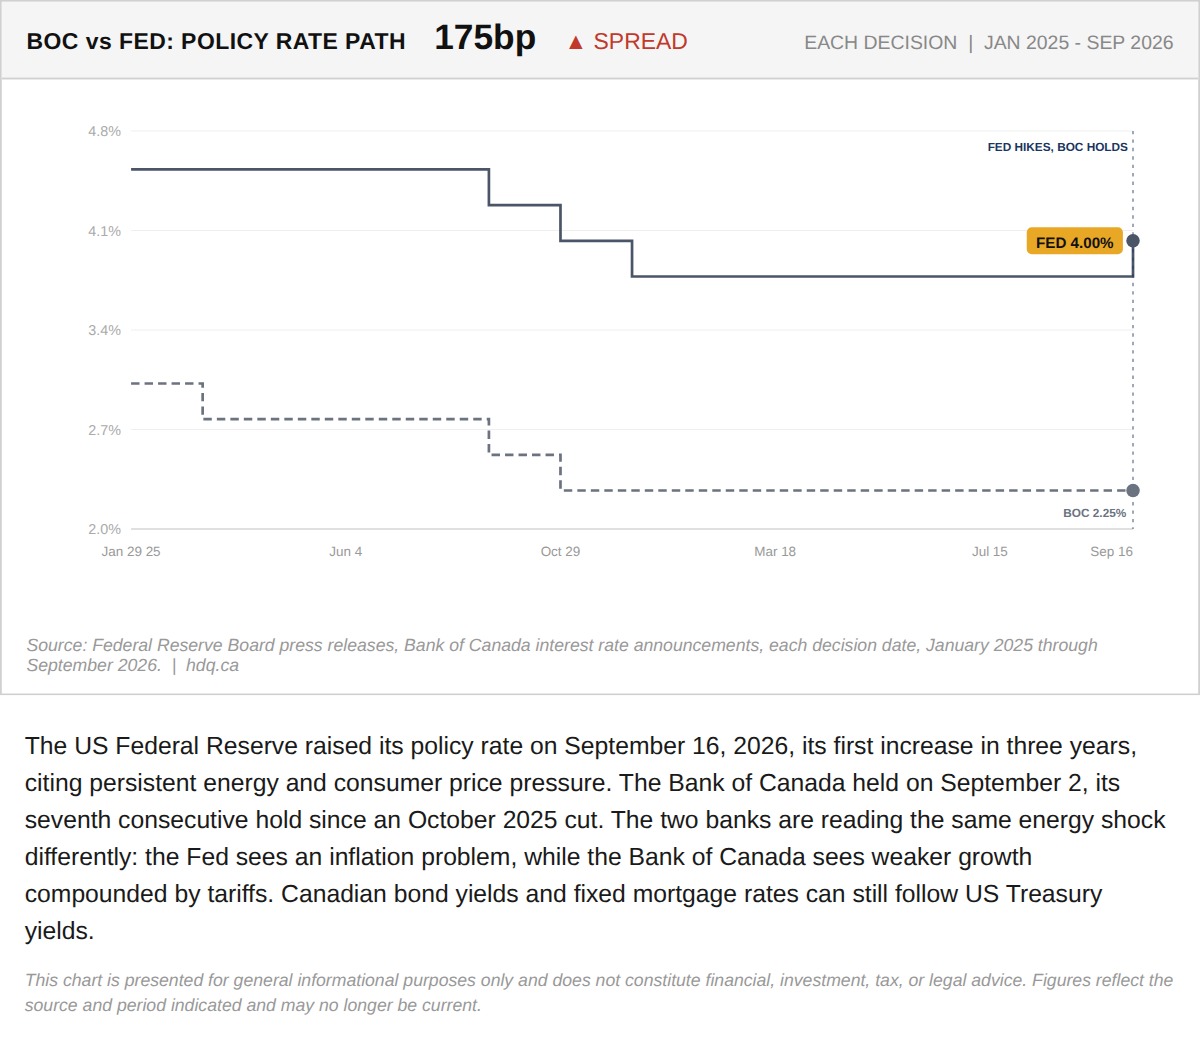
The US Federal Reserve raised its policy rate on September 16, 2026, its first increase in three years, citing persistent energy and consumer price pressure.
Why the Fed Just Broke Rank With the Bank of Canada
September 22, 2026
View chart & download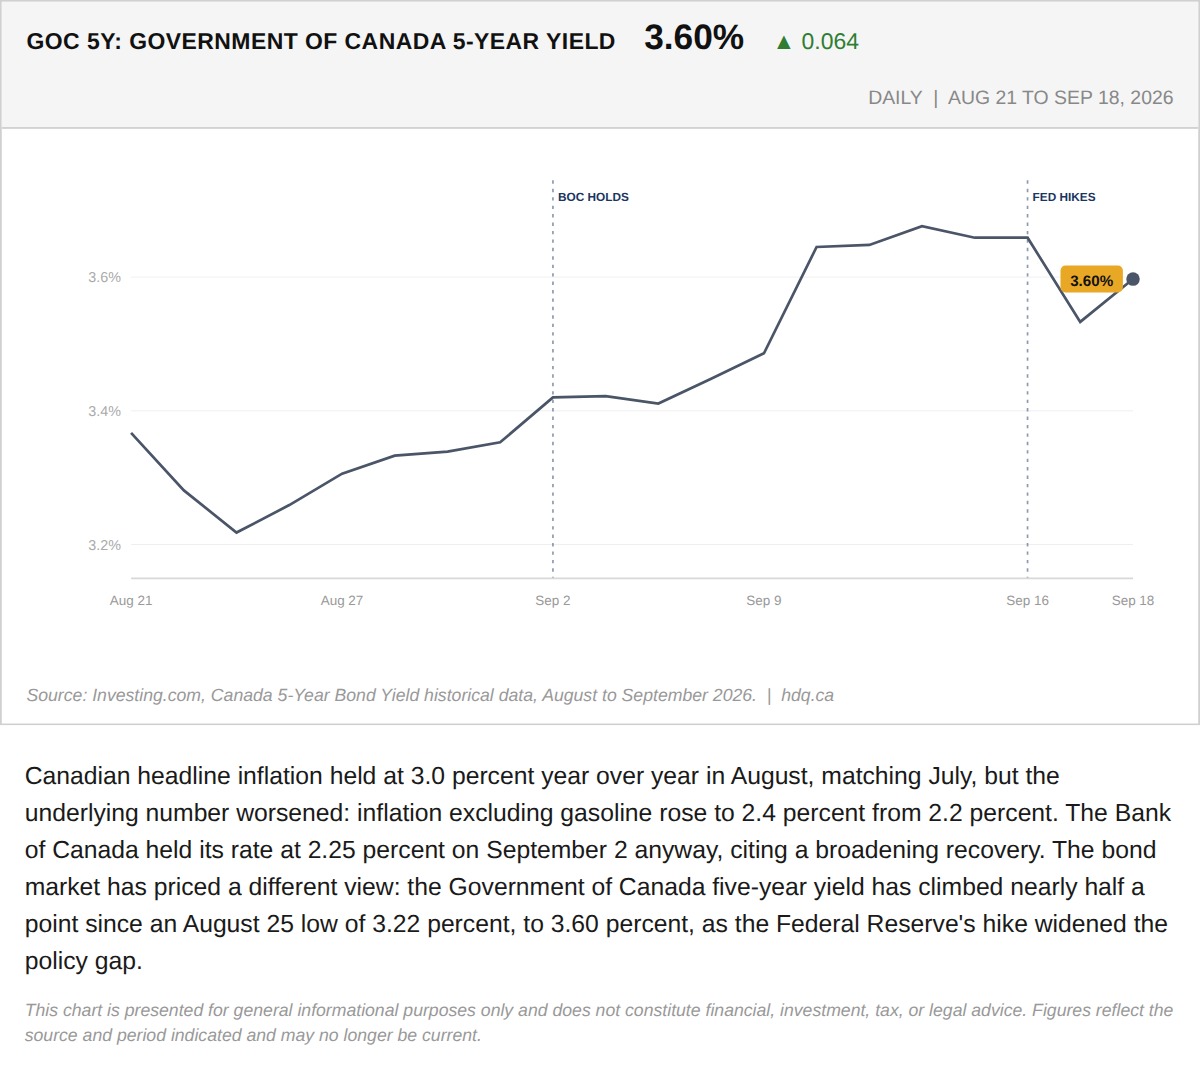
Canadian headline inflation held at 3.0 percent year over year in August, matching July, but the underlying number worsened: inflation…
The Bond Market Already Moved Before the Bank of Canada Has To
September 21, 2026
View chart & download