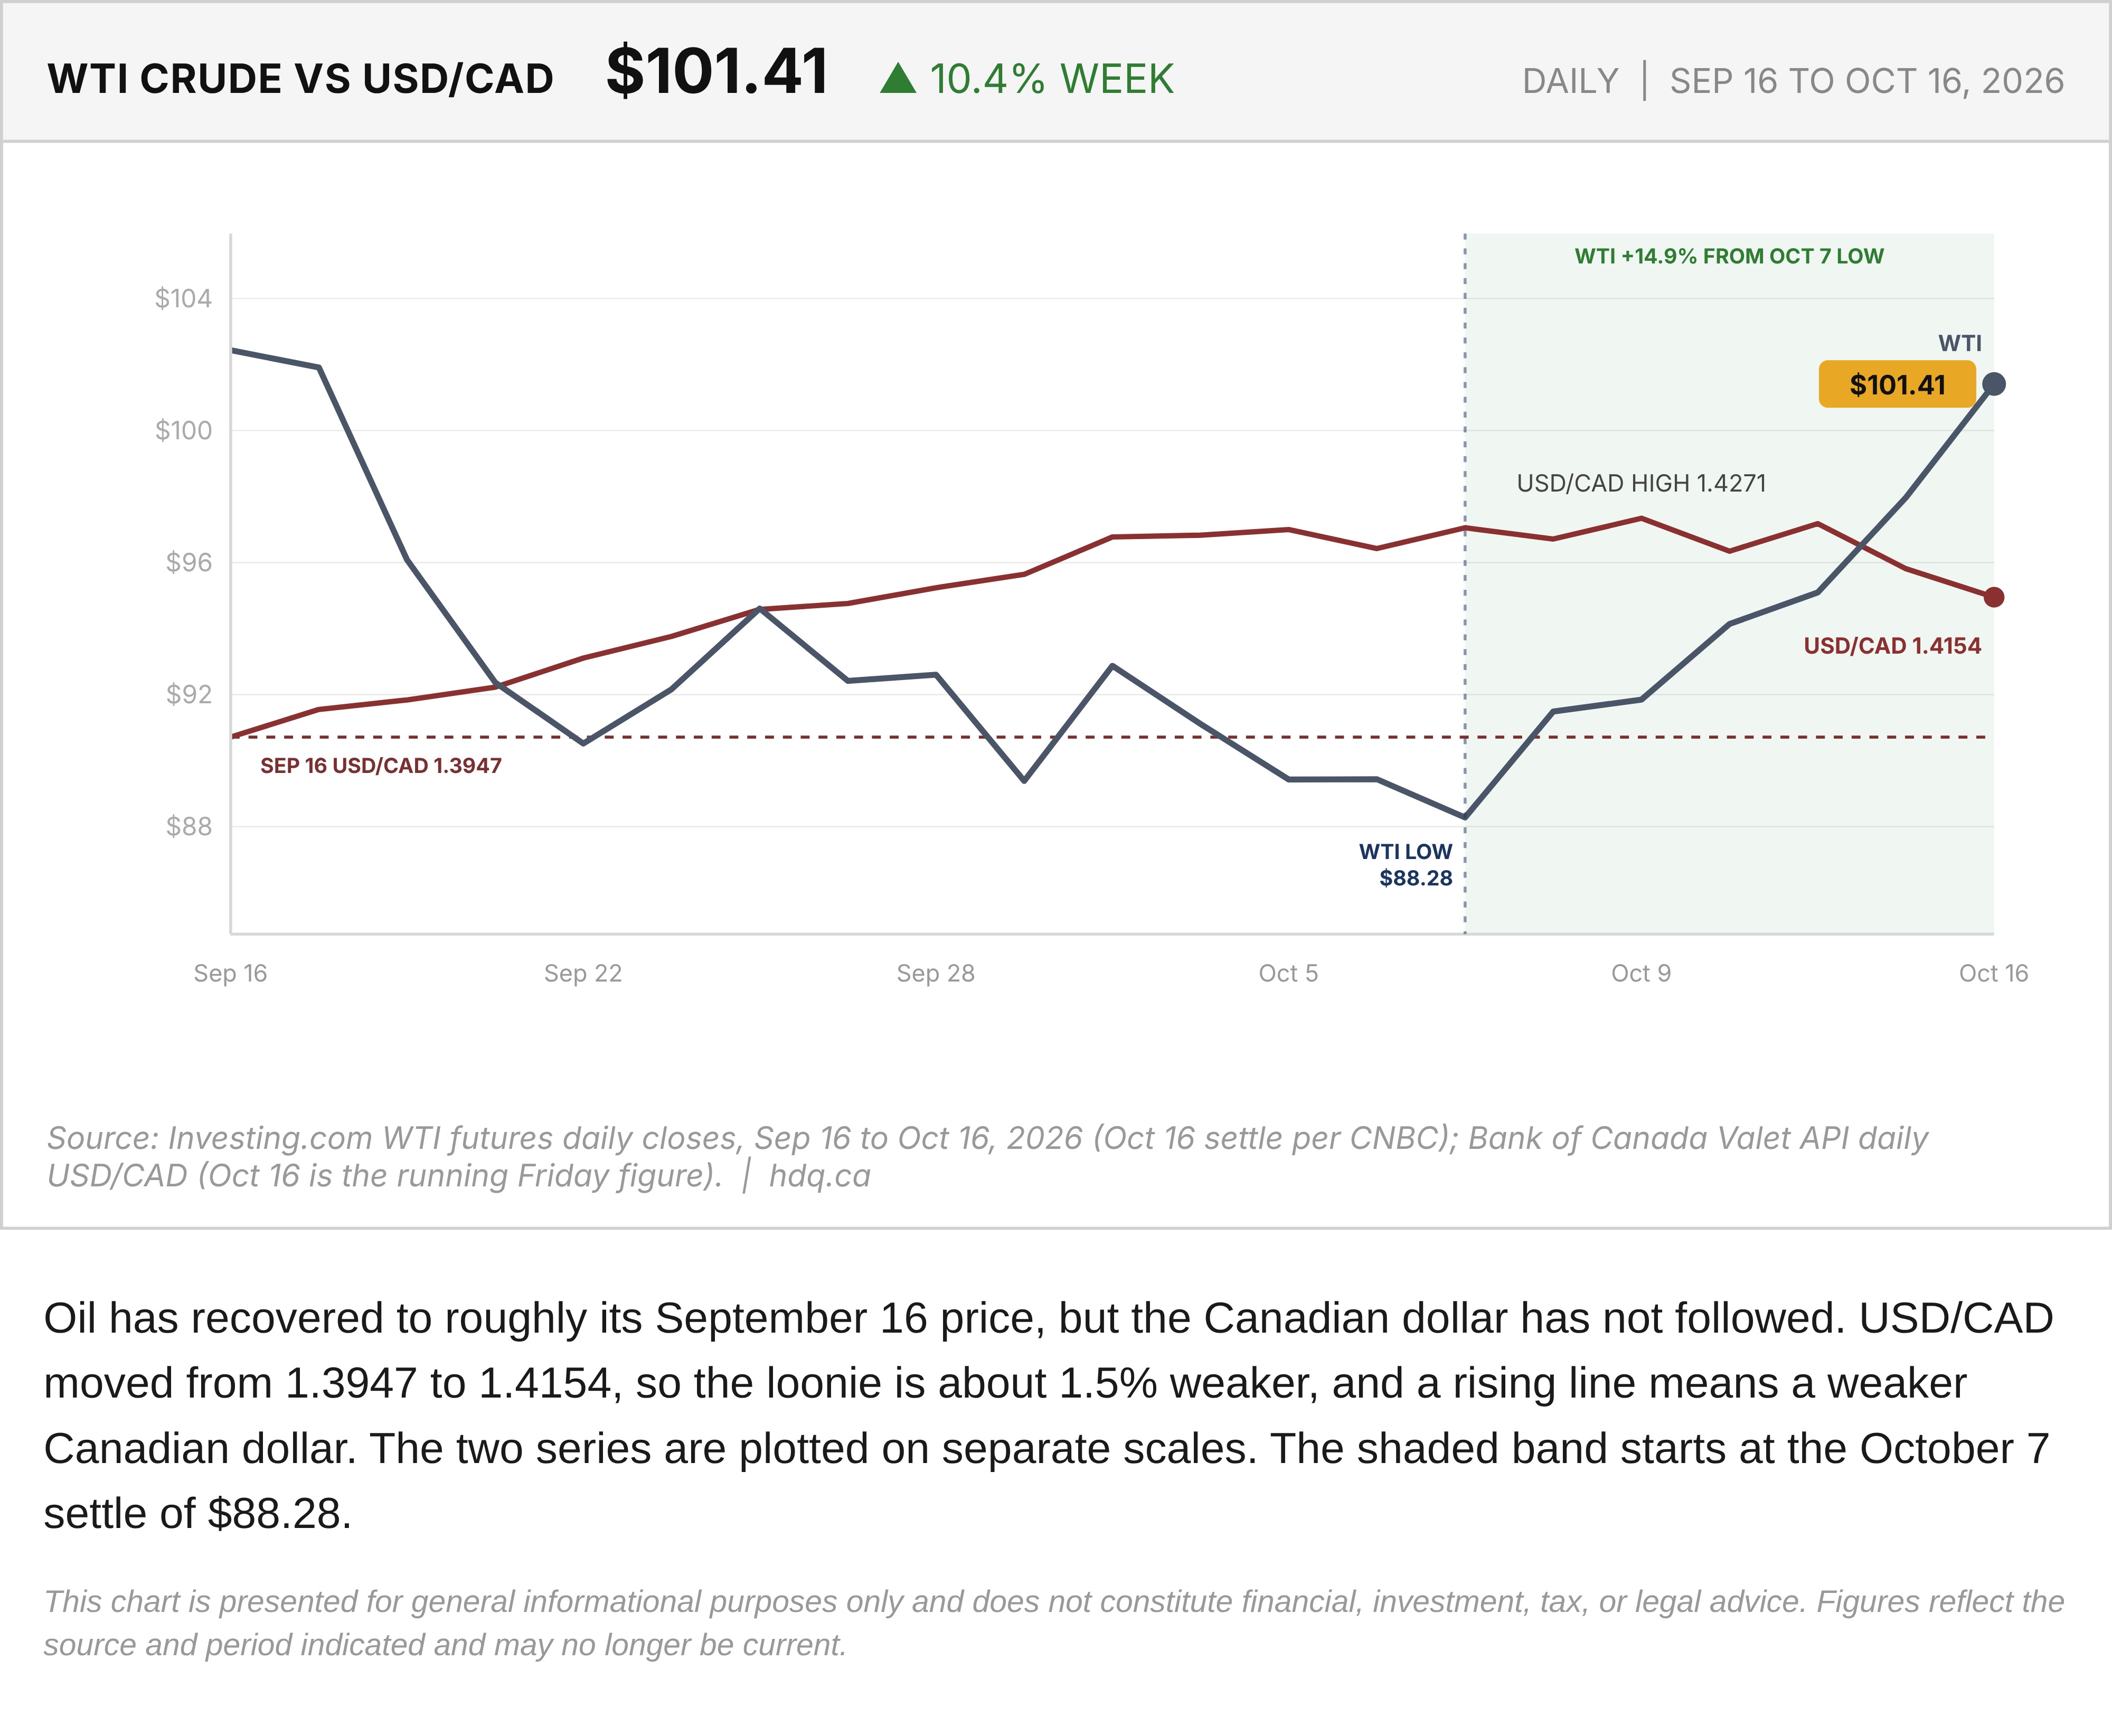
Oil has recovered to roughly its September 16 price, but the Canadian dollar has not followed. USD/CAD moved from 1.3947 to 1.4154, so the loonie is about 1.5% weaker, and a rising line means a weaker Canadian dollar. The two series are plotted on separate scales. The shaded band starts at the October 7 settle of $88.28.
This chart is presented for general informational purposes only and does not constitute financial, investment, tax, or legal advice. Figures reflect the source and period indicated and may no longer be current.
Related charts
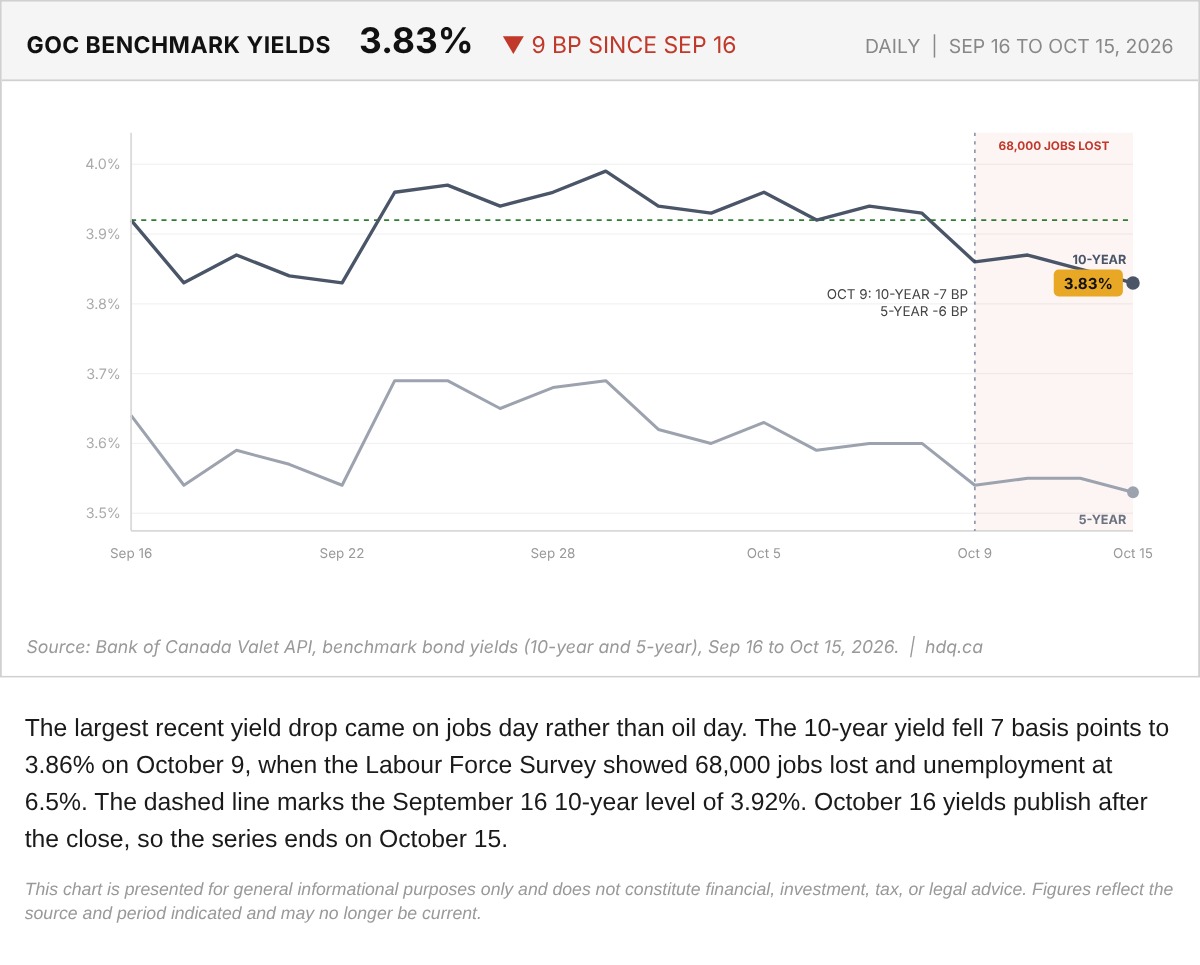
The largest recent yield drop came on jobs day rather than oil day.
Government of Canada Benchmark Bond Yields, September 16 to October 15, 2026
October 15, 2026
View chart & download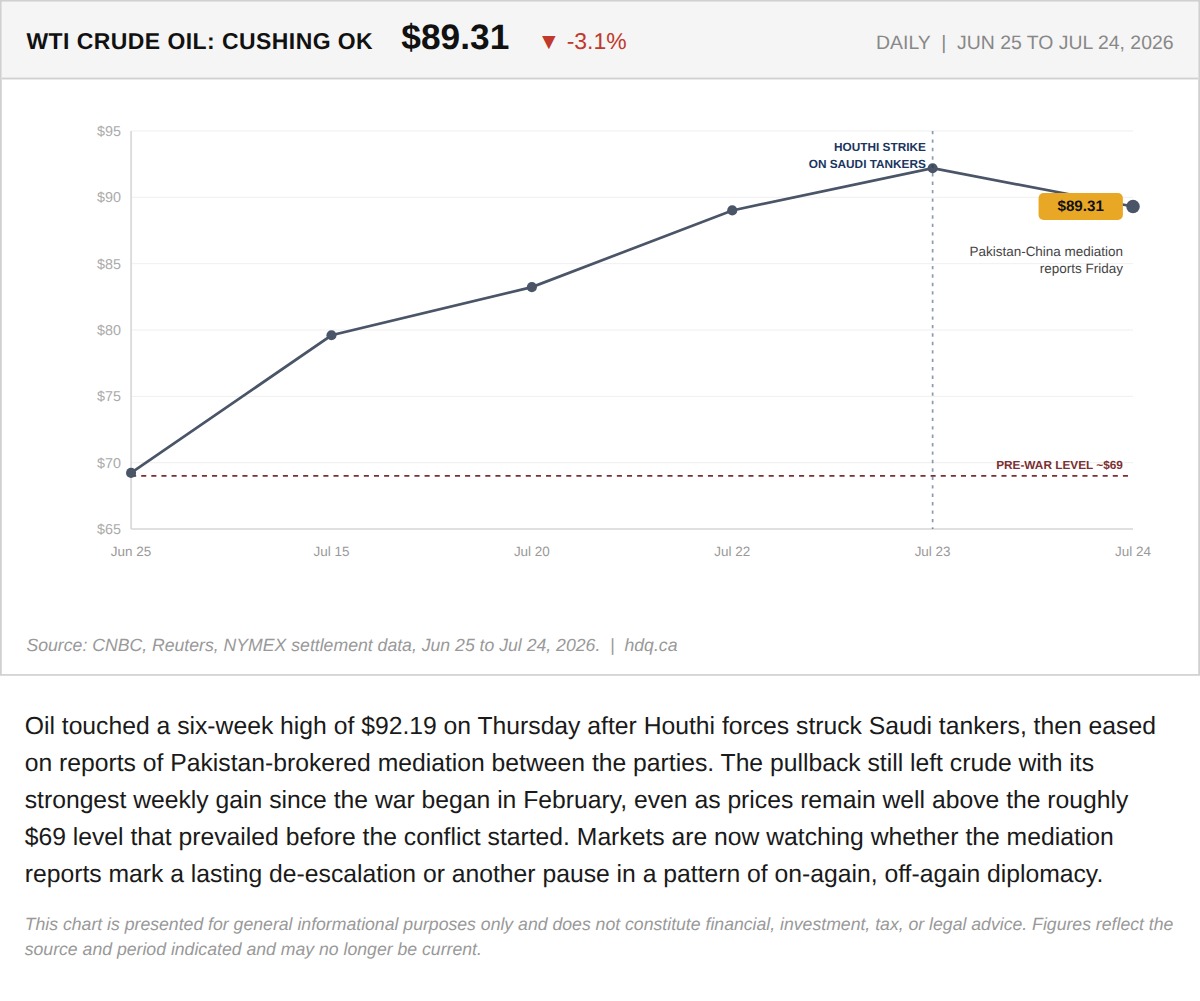
Oil touched a six-week high of $92.19 on Thursday after Houthi forces struck Saudi tankers, then eased on reports of Pakistan-brokered mediation between the parties.
Oil Pulls Back to $89.31 After Six-Week High on Mediation Reports
July 25, 2026
View chart & download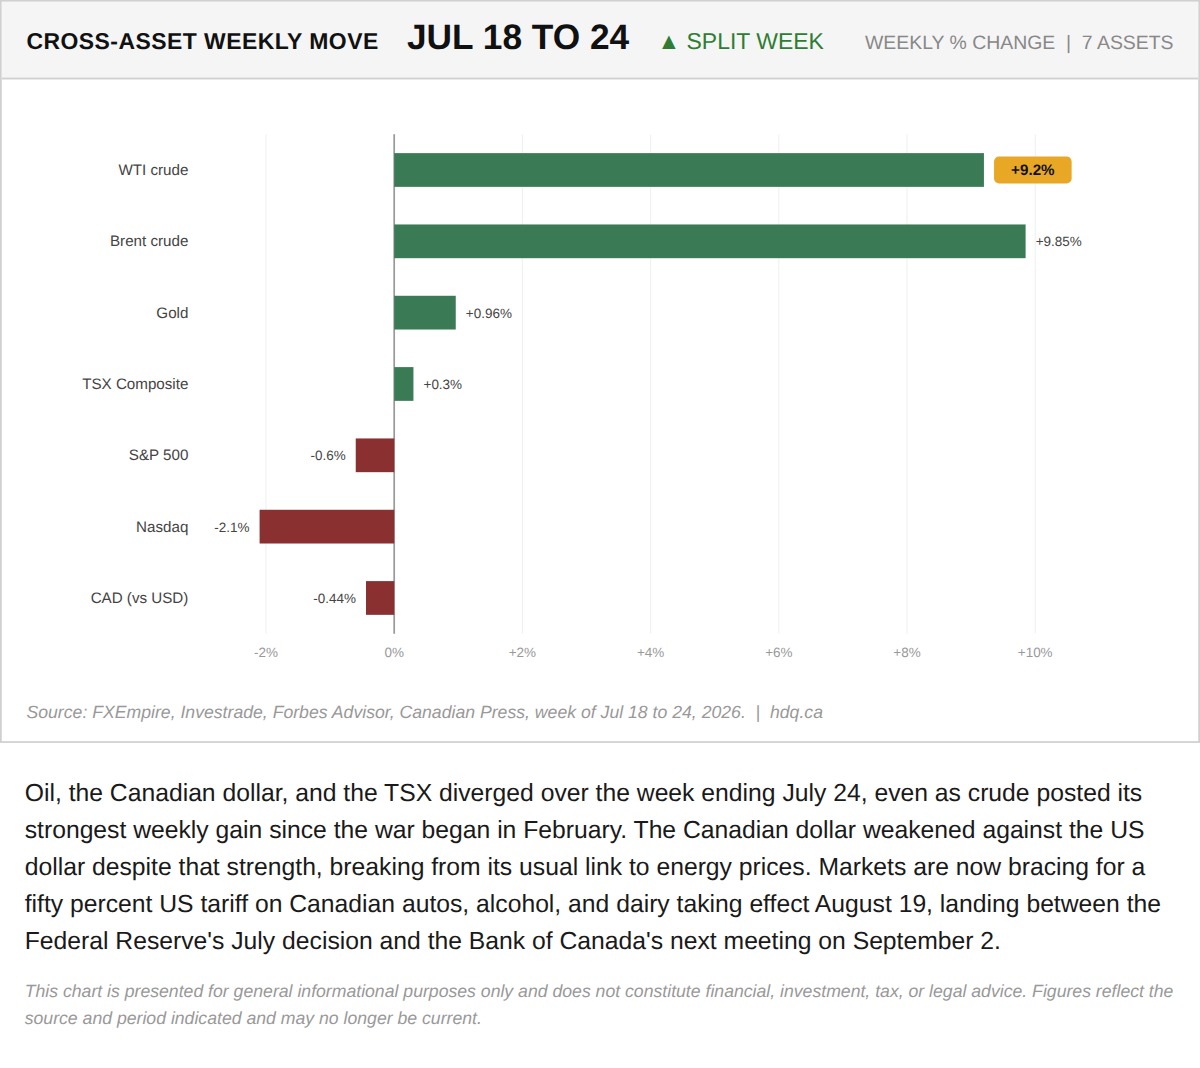
Oil, the Canadian dollar, and the TSX diverged over the week ending July 24, even as crude posted its strongest weekly gain since the war began in February.
Cross-Asset Weekly Moves: Oil Rallies, Loonie Falls Anyway
July 25, 2026
View chart & download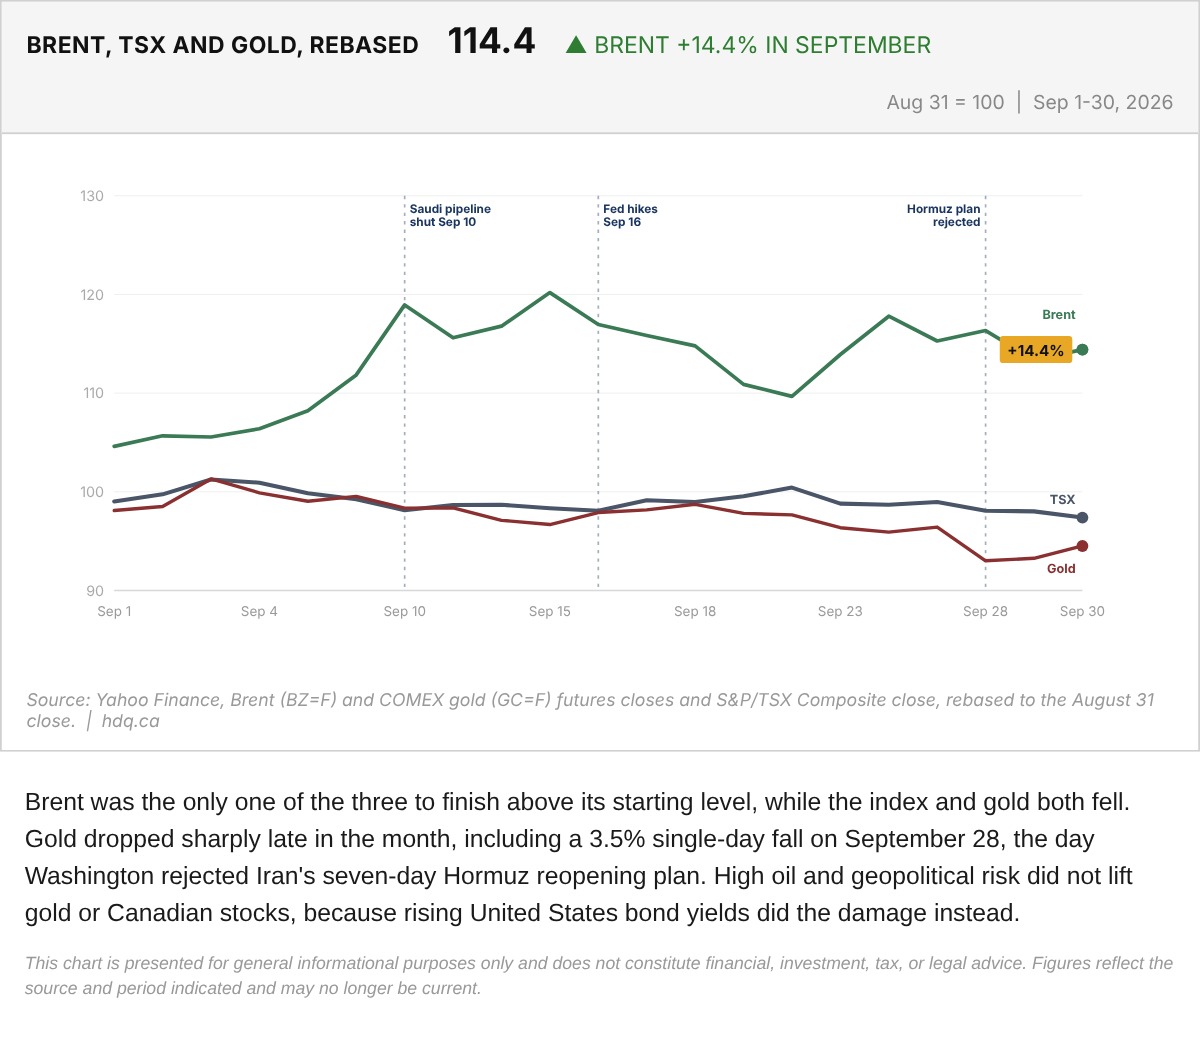
Brent was the only one of the three to finish above its starting level, while the index and gold both fell.
Brent, TSX and Gold Rebased to the August 31 Close
September 30, 2026
View chart & download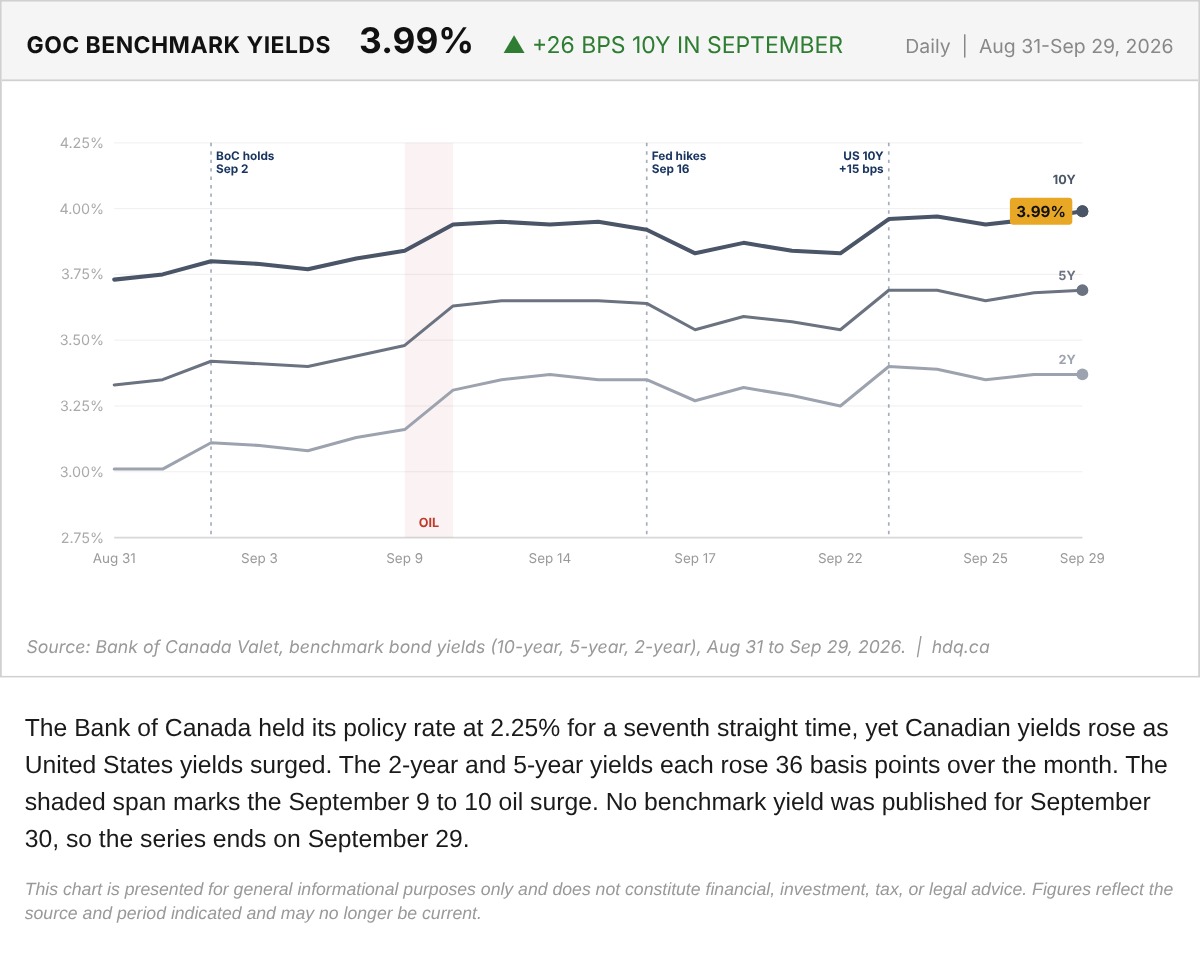
The Bank of Canada held its policy rate at 2.25% for a seventh straight time, yet Canadian yields rose as United States yields surged.
Government of Canada Benchmark Yields, September 2026
September 30, 2026
View chart & download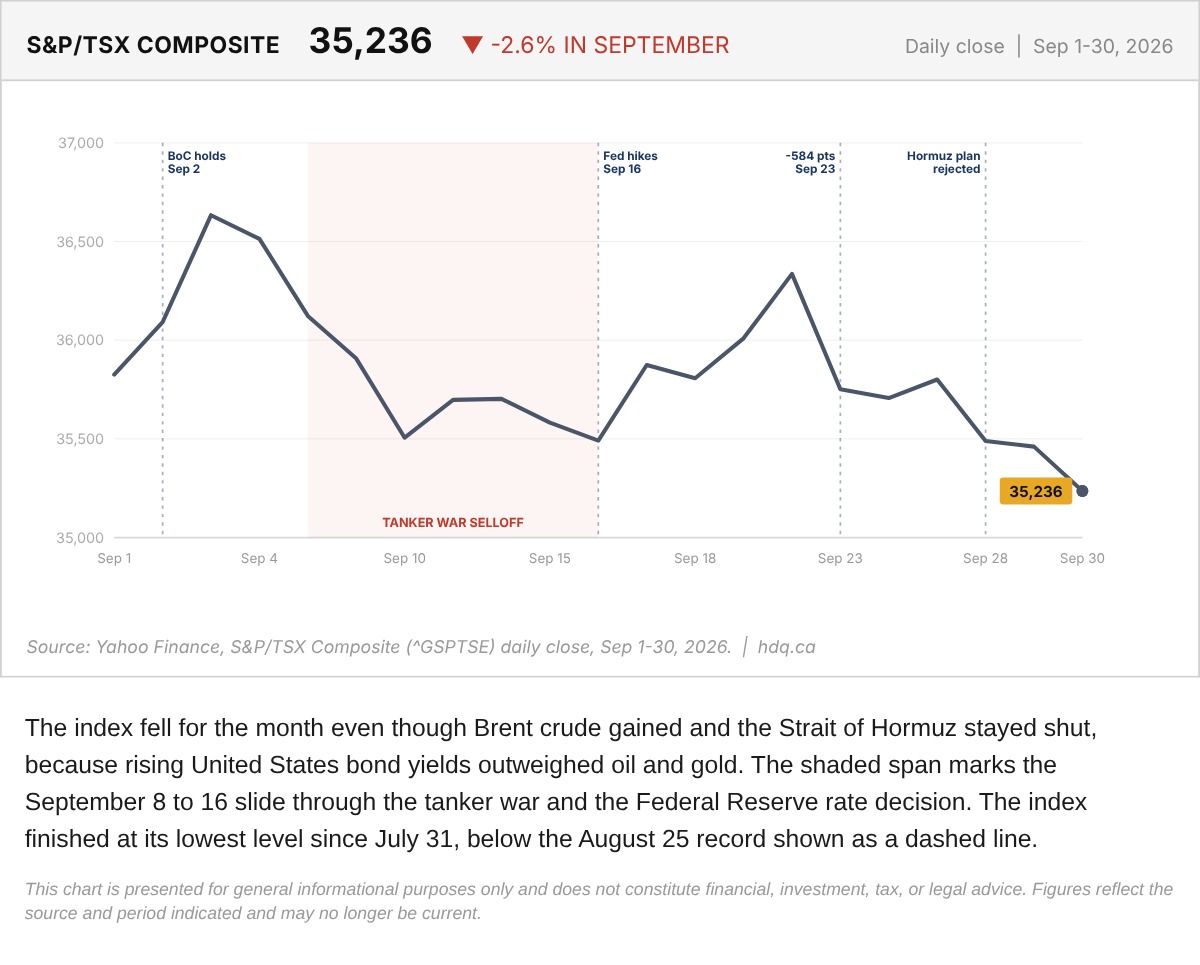
The index fell for the month even though Brent crude gained and the Strait of Hormuz stayed shut, because rising United States bond yields outweighed oil and gold.
S&P/TSX Composite Daily Close Through September 2026
September 30, 2026
View chart & download