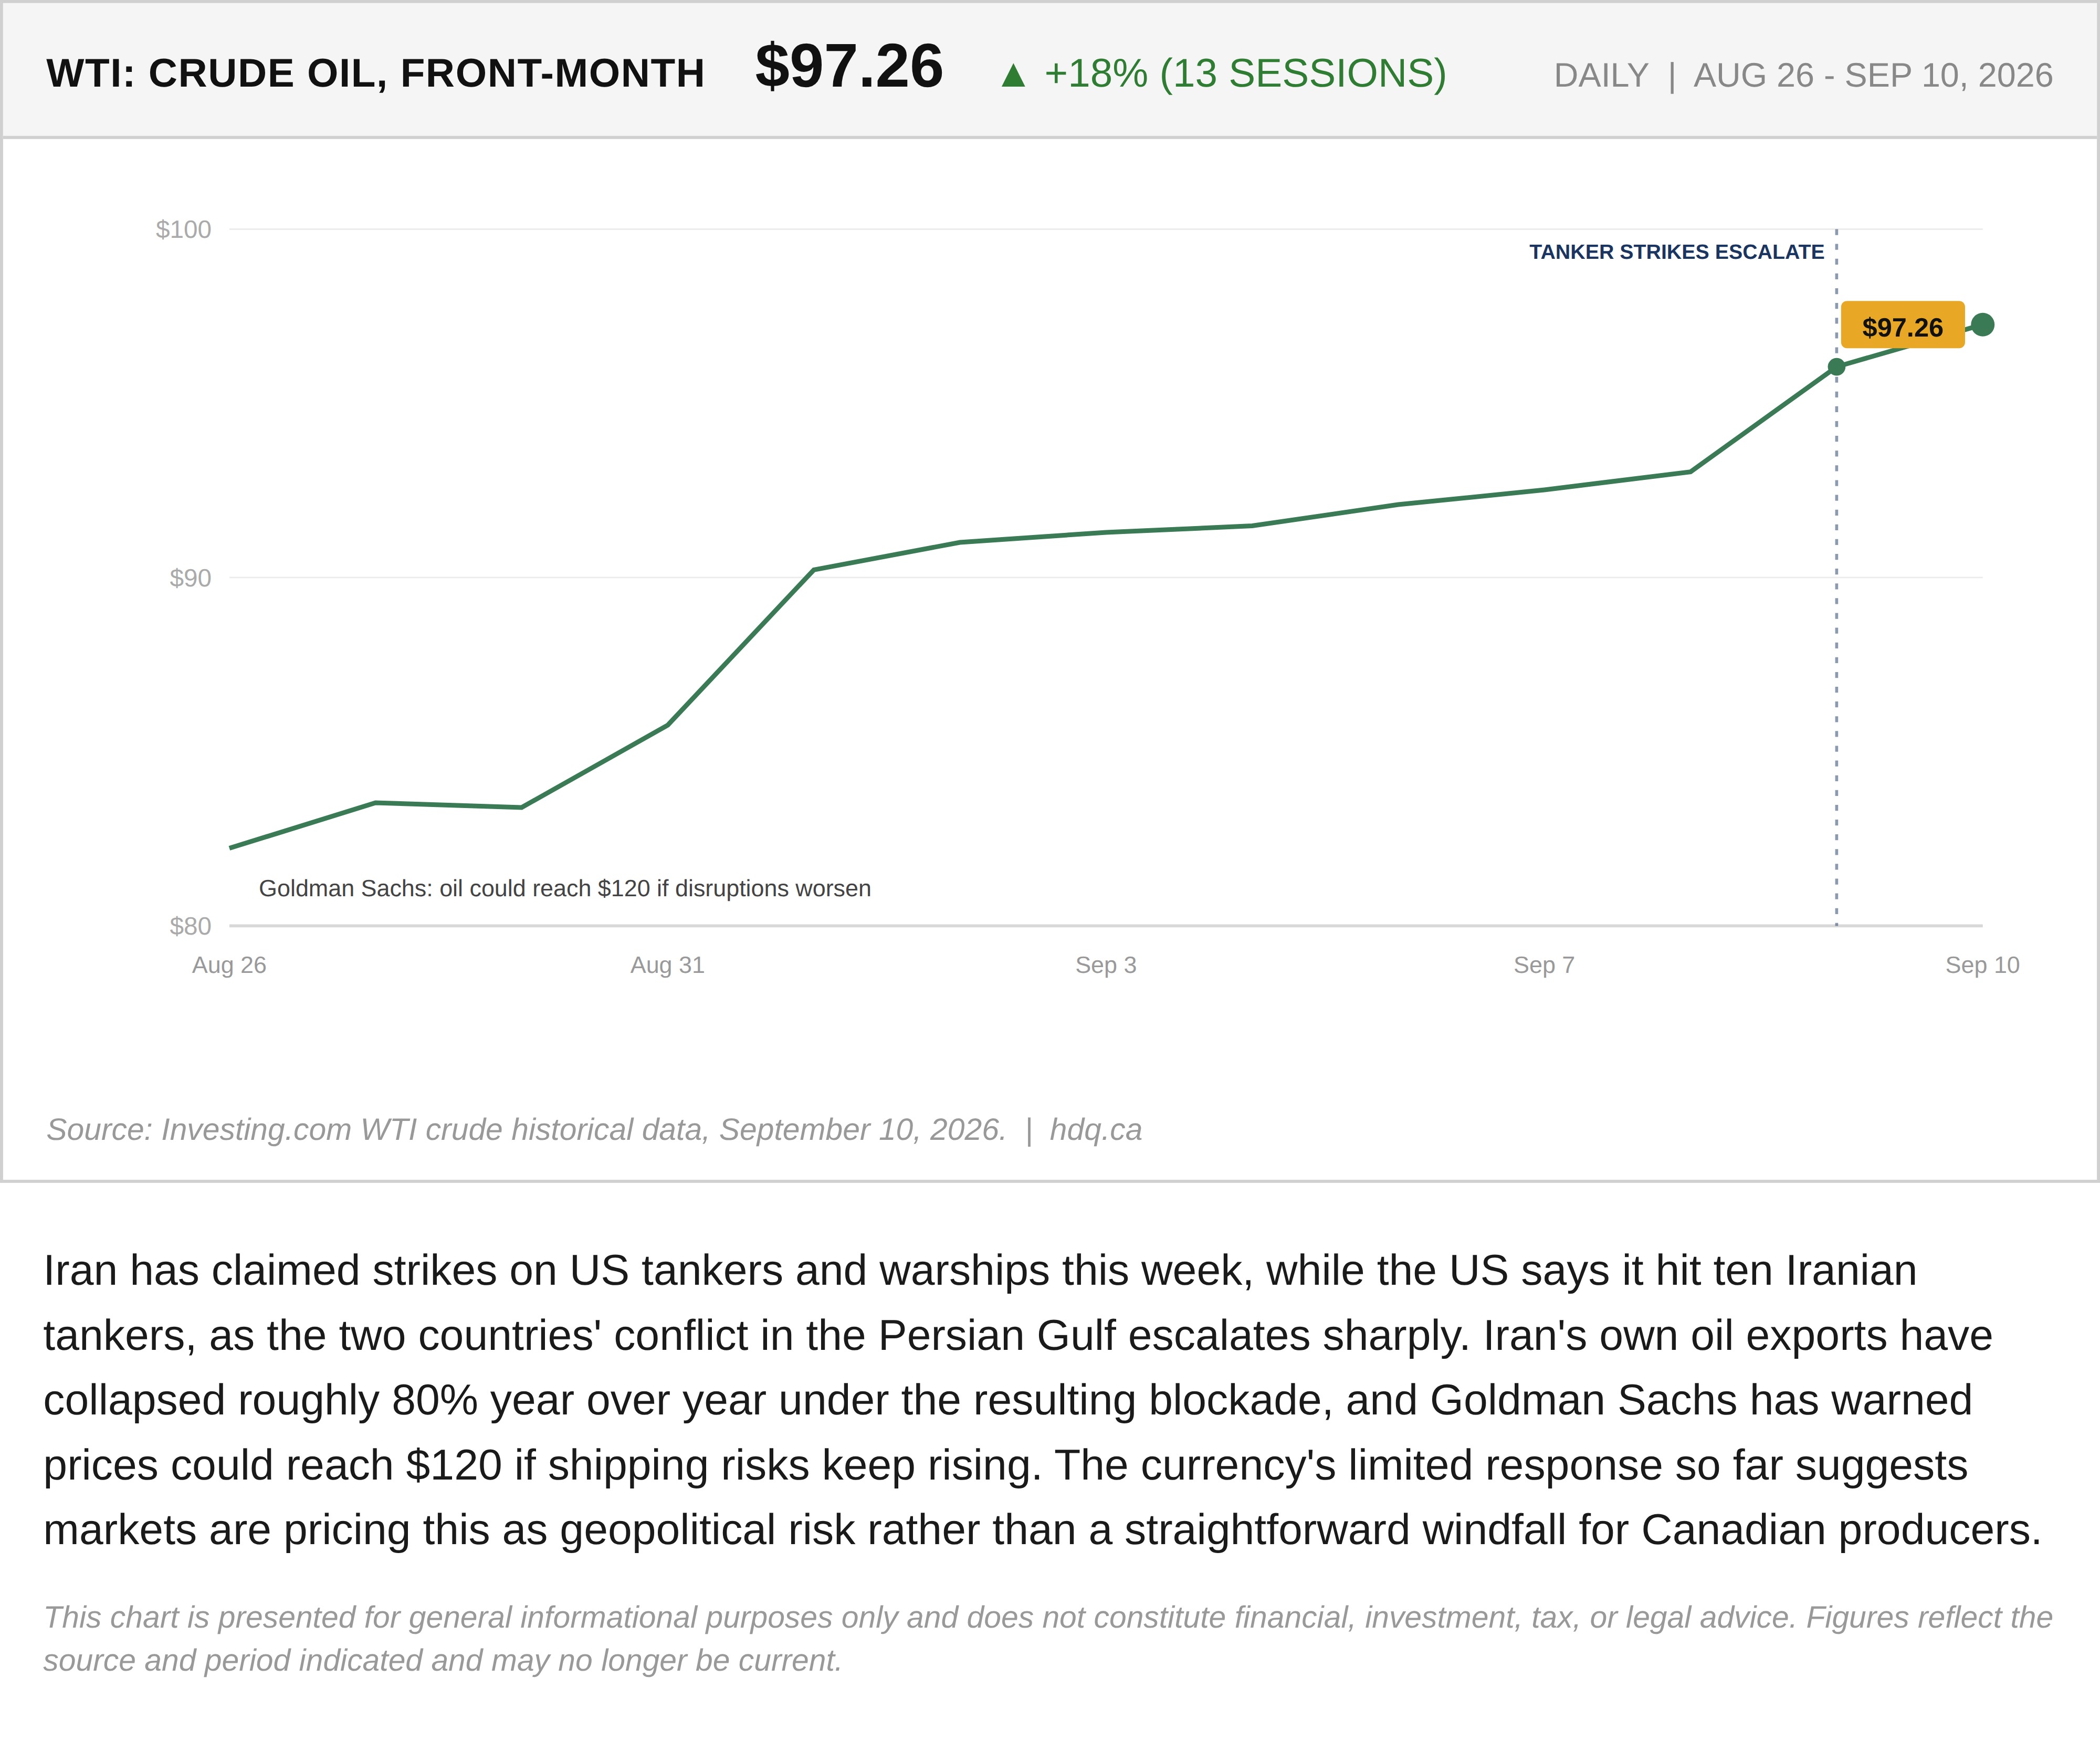
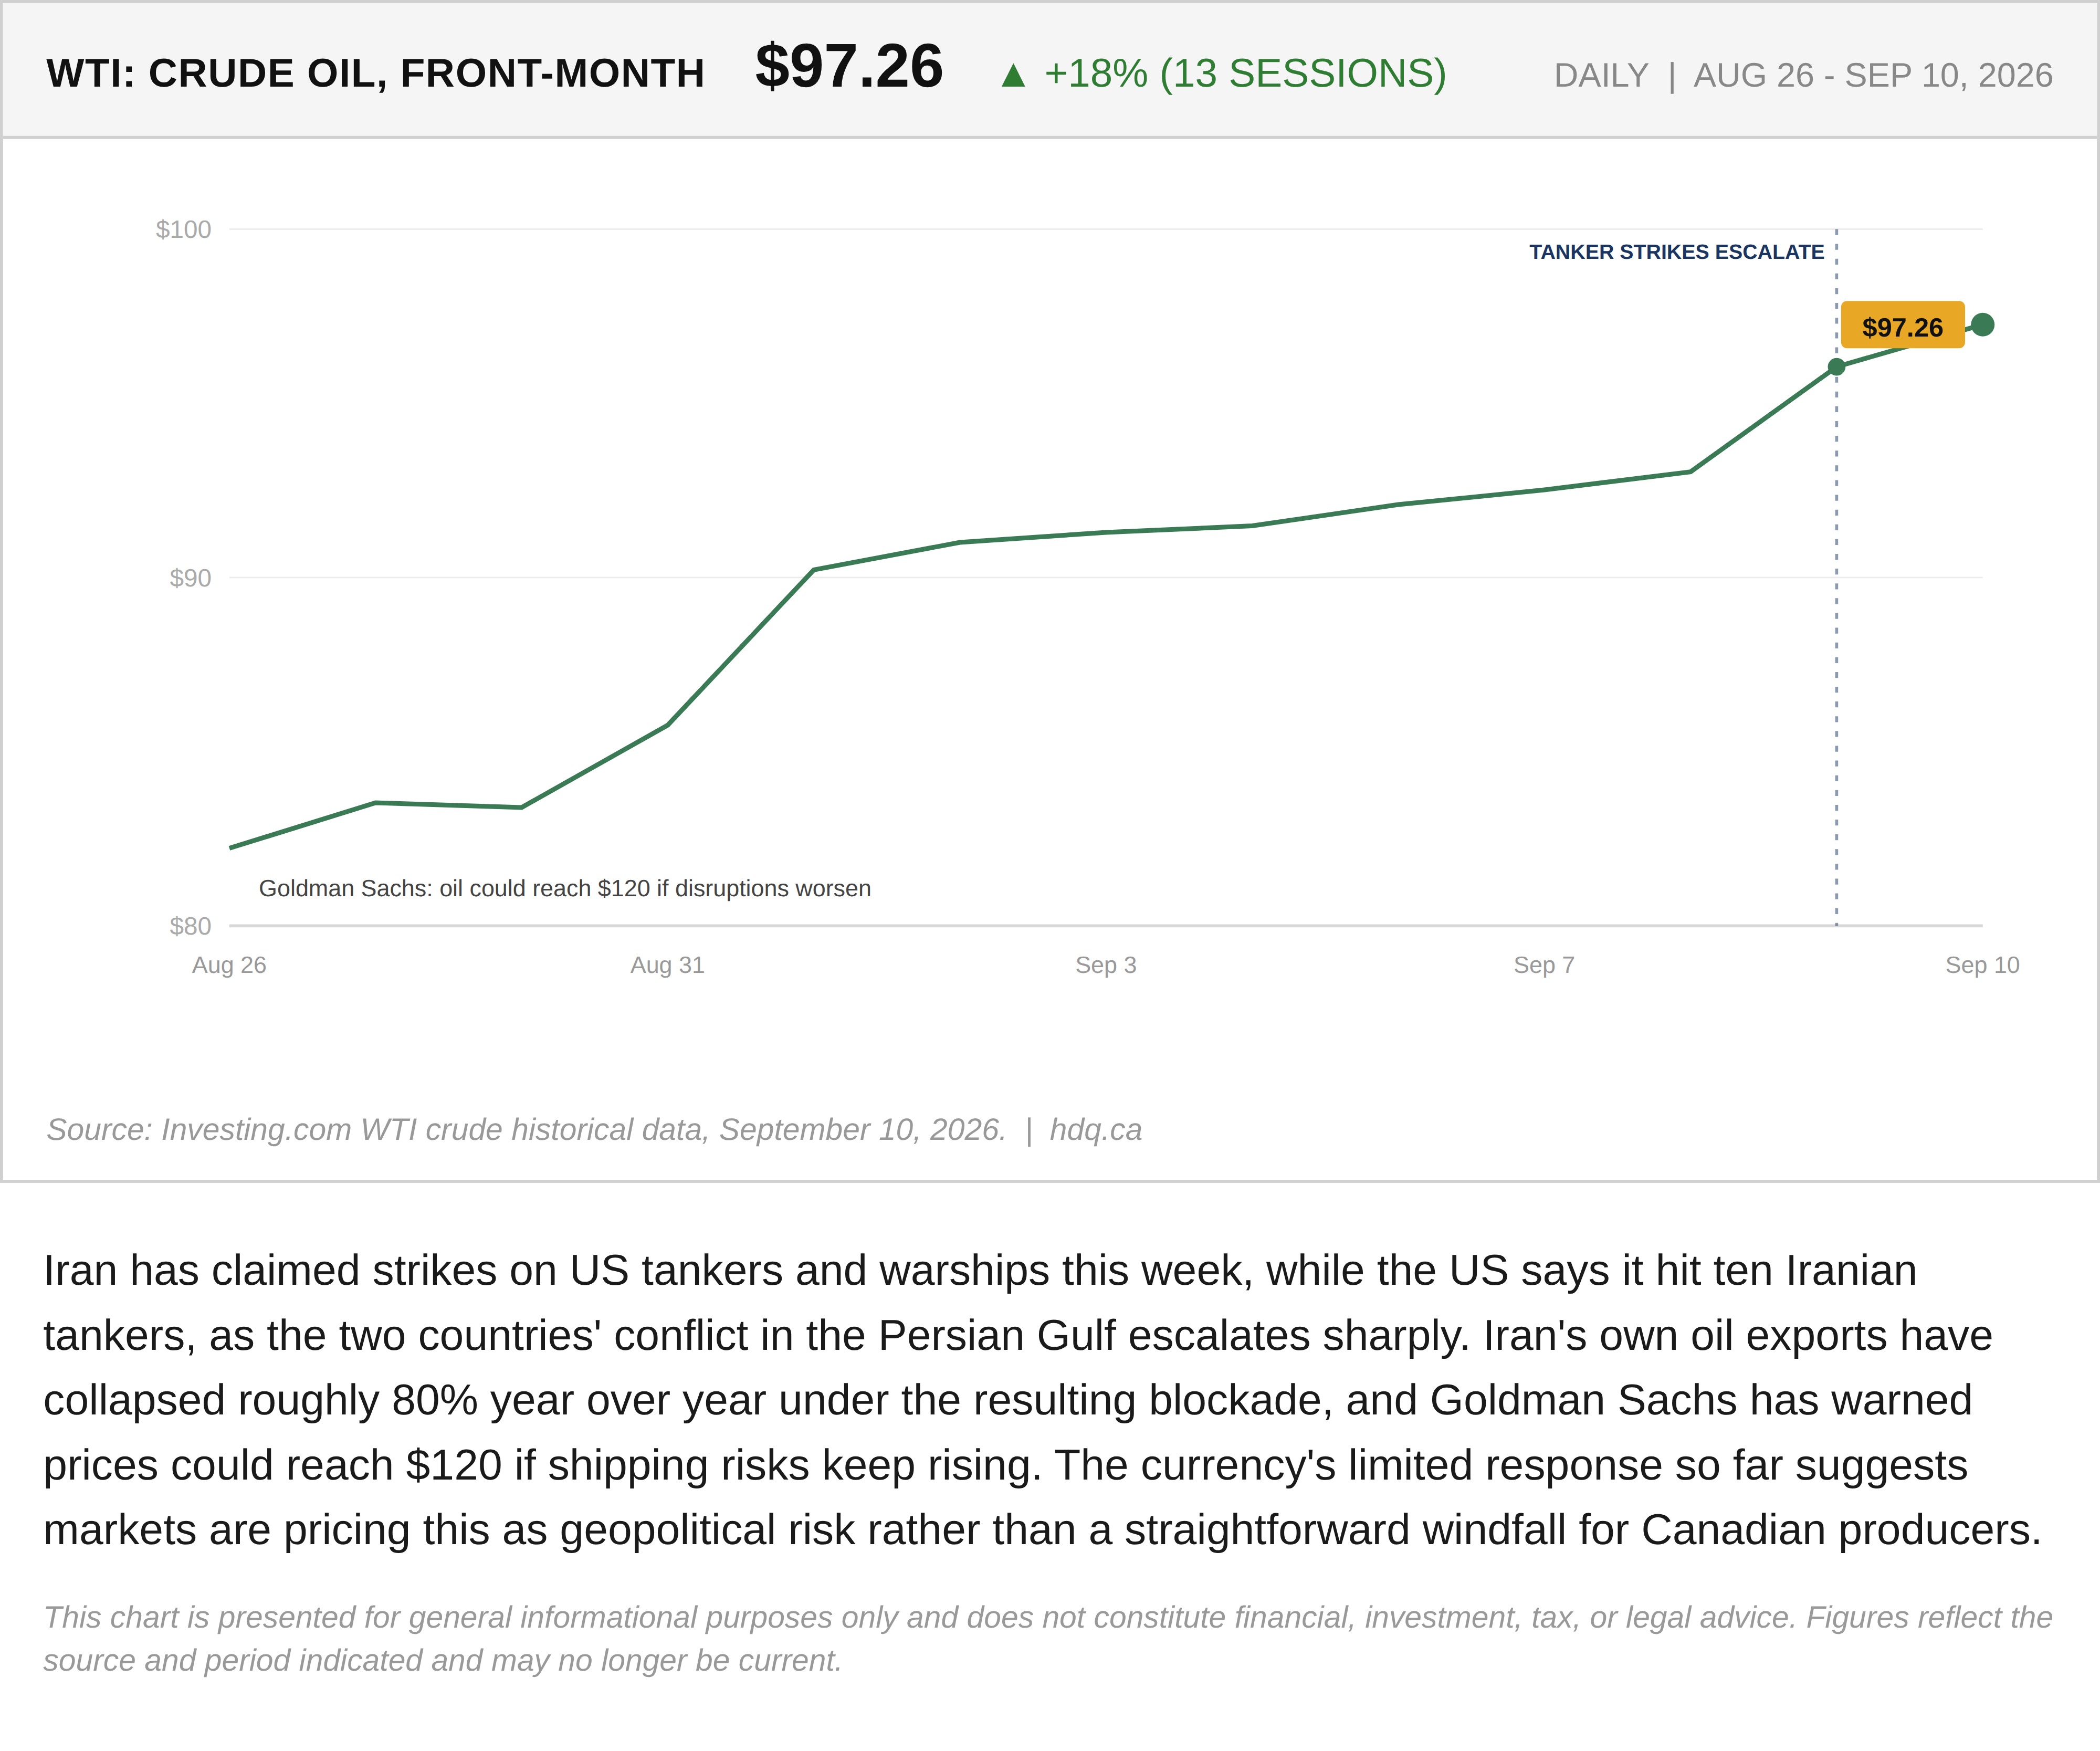
Iran has claimed strikes on US tankers and warships this week, while the US says it hit ten Iranian tankers, as the two countries' conflict in the Persian Gulf escalates sharply. Iran's own oil exports have collapsed roughly 80% year over year under the resulting blockade, and Goldman Sachs has warned prices could reach $120 if shipping risks keep rising. The currency's limited response so far suggests markets are pricing this as geopolitical risk rather than a straightforward windfall for Canadian producers.
This chart is presented for general informational purposes only and does not constitute financial, investment, tax, or legal advice. Figures reflect the source and period indicated and may no longer be current.
Related charts
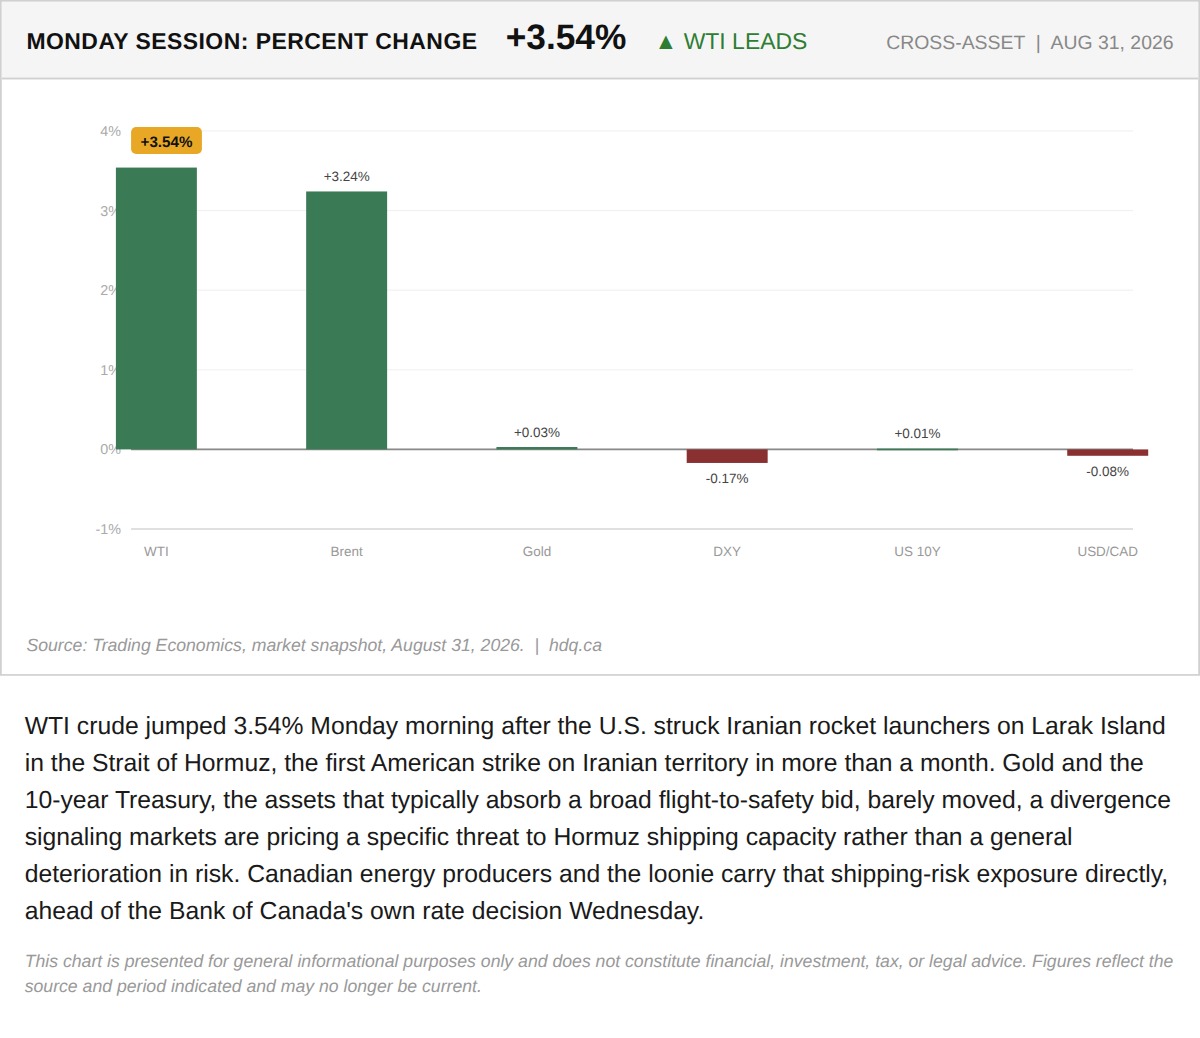
WTI crude jumped 3.54% Monday morning after the U.S.
The US and Iran Exchanged Strikes This Weekend. Only Oil Is Actually Pricing It
August 31, 2026
View chart & download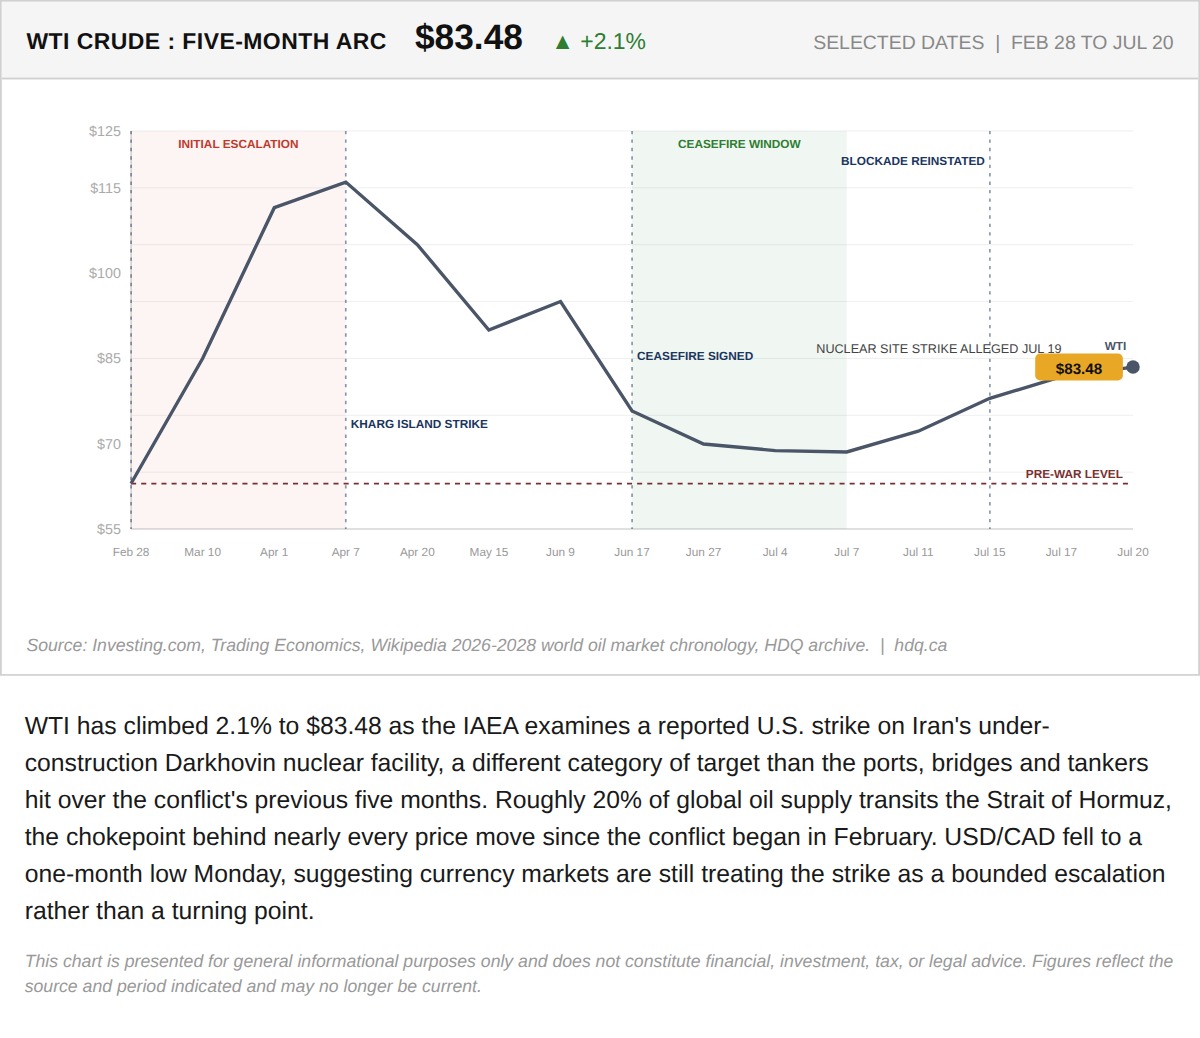
WTI has climbed 2.1% to $83.48 as the IAEA examines a reported U.S.
July 20, 2026
View chart & download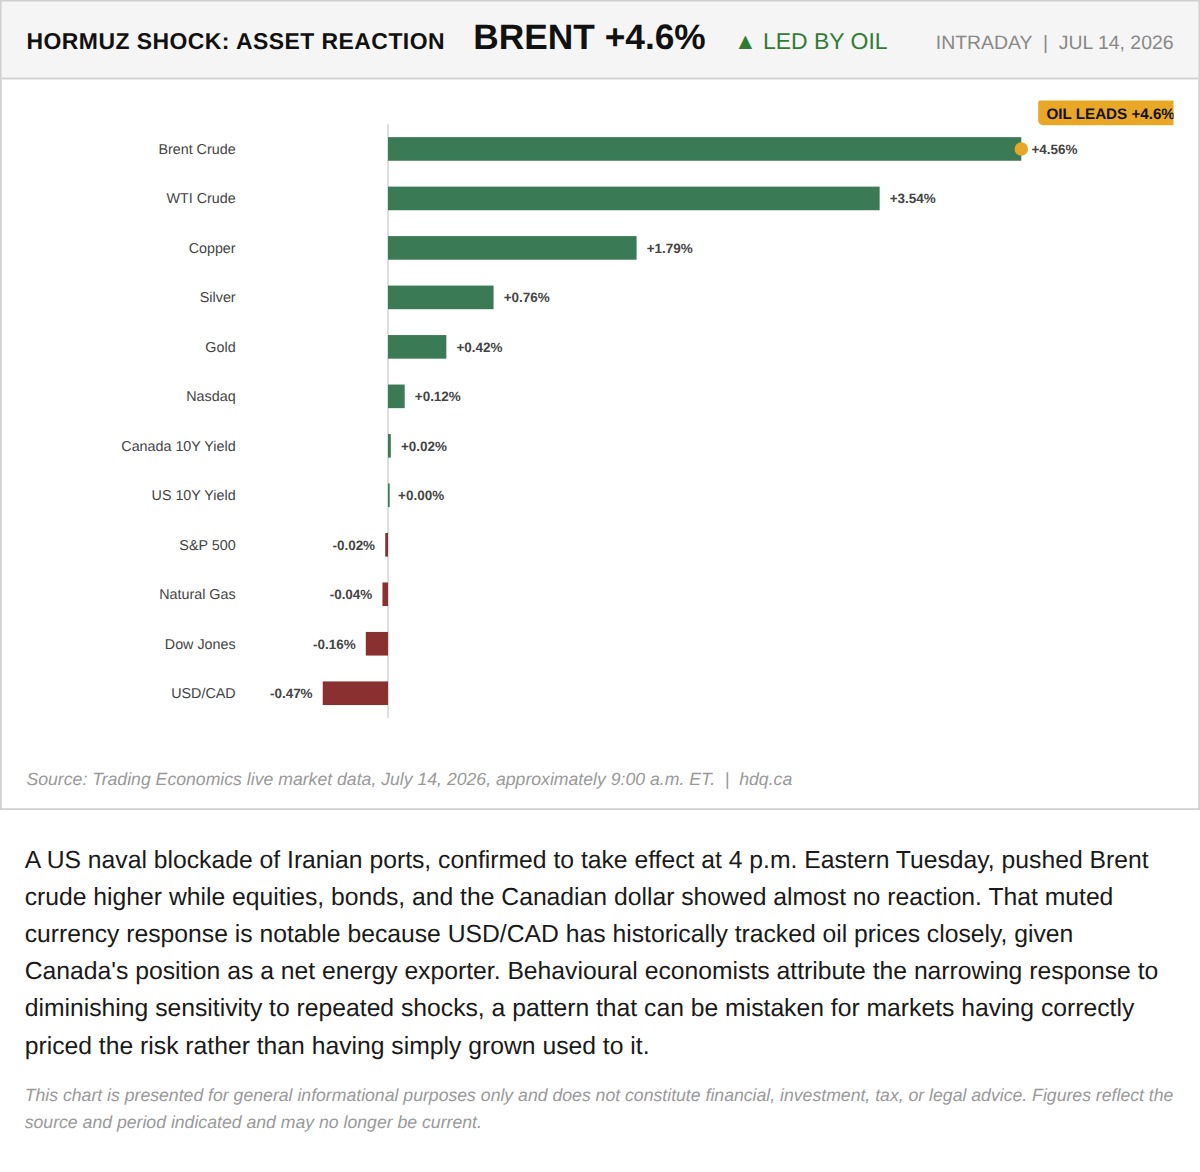
A US naval blockade of Iranian ports, confirmed to take effect at 4 p.m.
Oil Jumped Five Percent Tuesday. Almost Nothing Else Moved.
July 14, 2026
View chart & download
Brent was the only one of the three to finish above its starting level, while the index and gold both fell.
Brent, TSX and Gold Rebased to the August 31 Close
September 30, 2026
View chart & download
The Bank of Canada held its policy rate at 2.25% for a seventh straight time, yet Canadian yields rose as United States yields surged.
Government of Canada Benchmark Yields, September 2026
September 30, 2026
View chart & download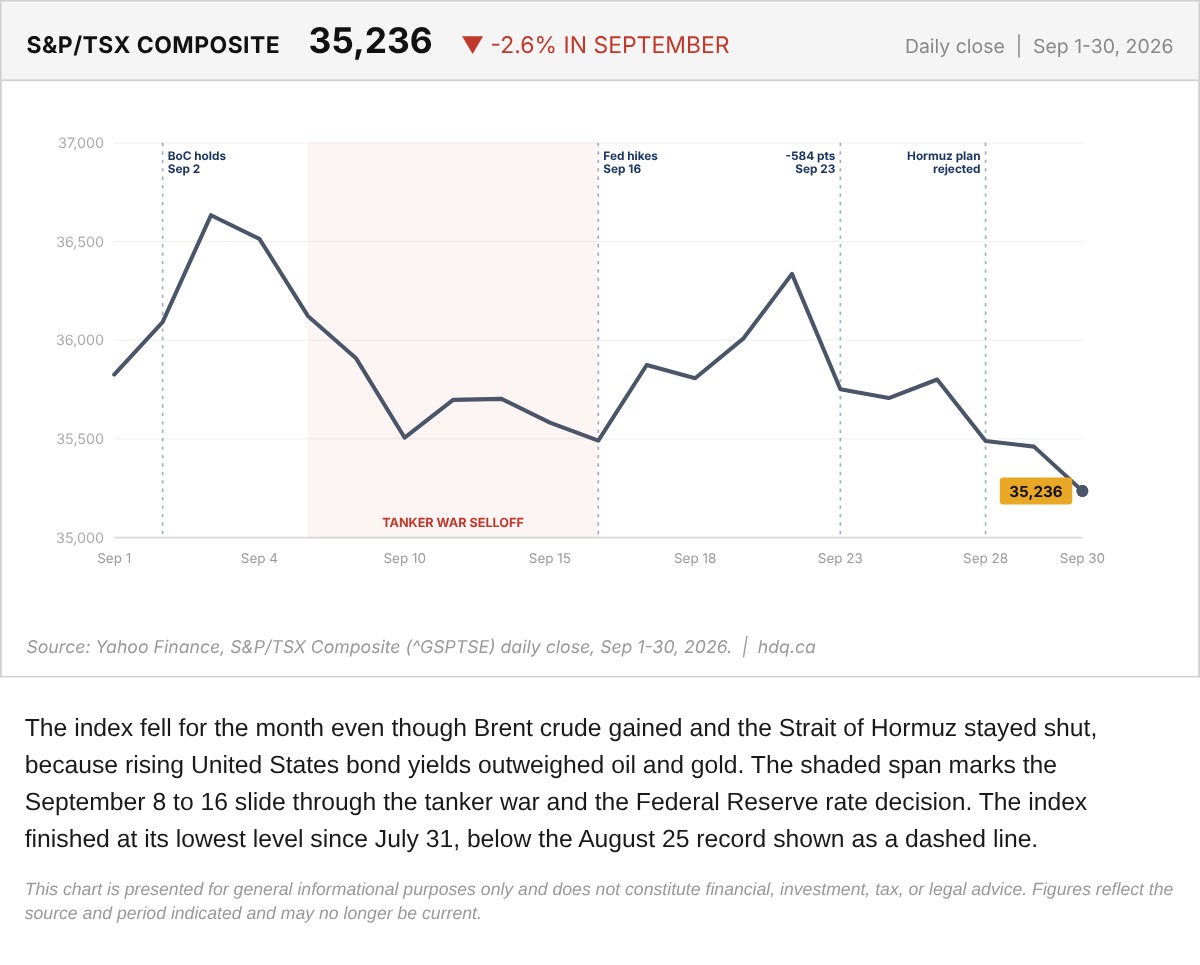
The index fell for the month even though Brent crude gained and the Strait of Hormuz stayed shut, because rising United States bond yields outweighed oil and gold.
S&P/TSX Composite Daily Close Through September 2026
September 30, 2026
View chart & download