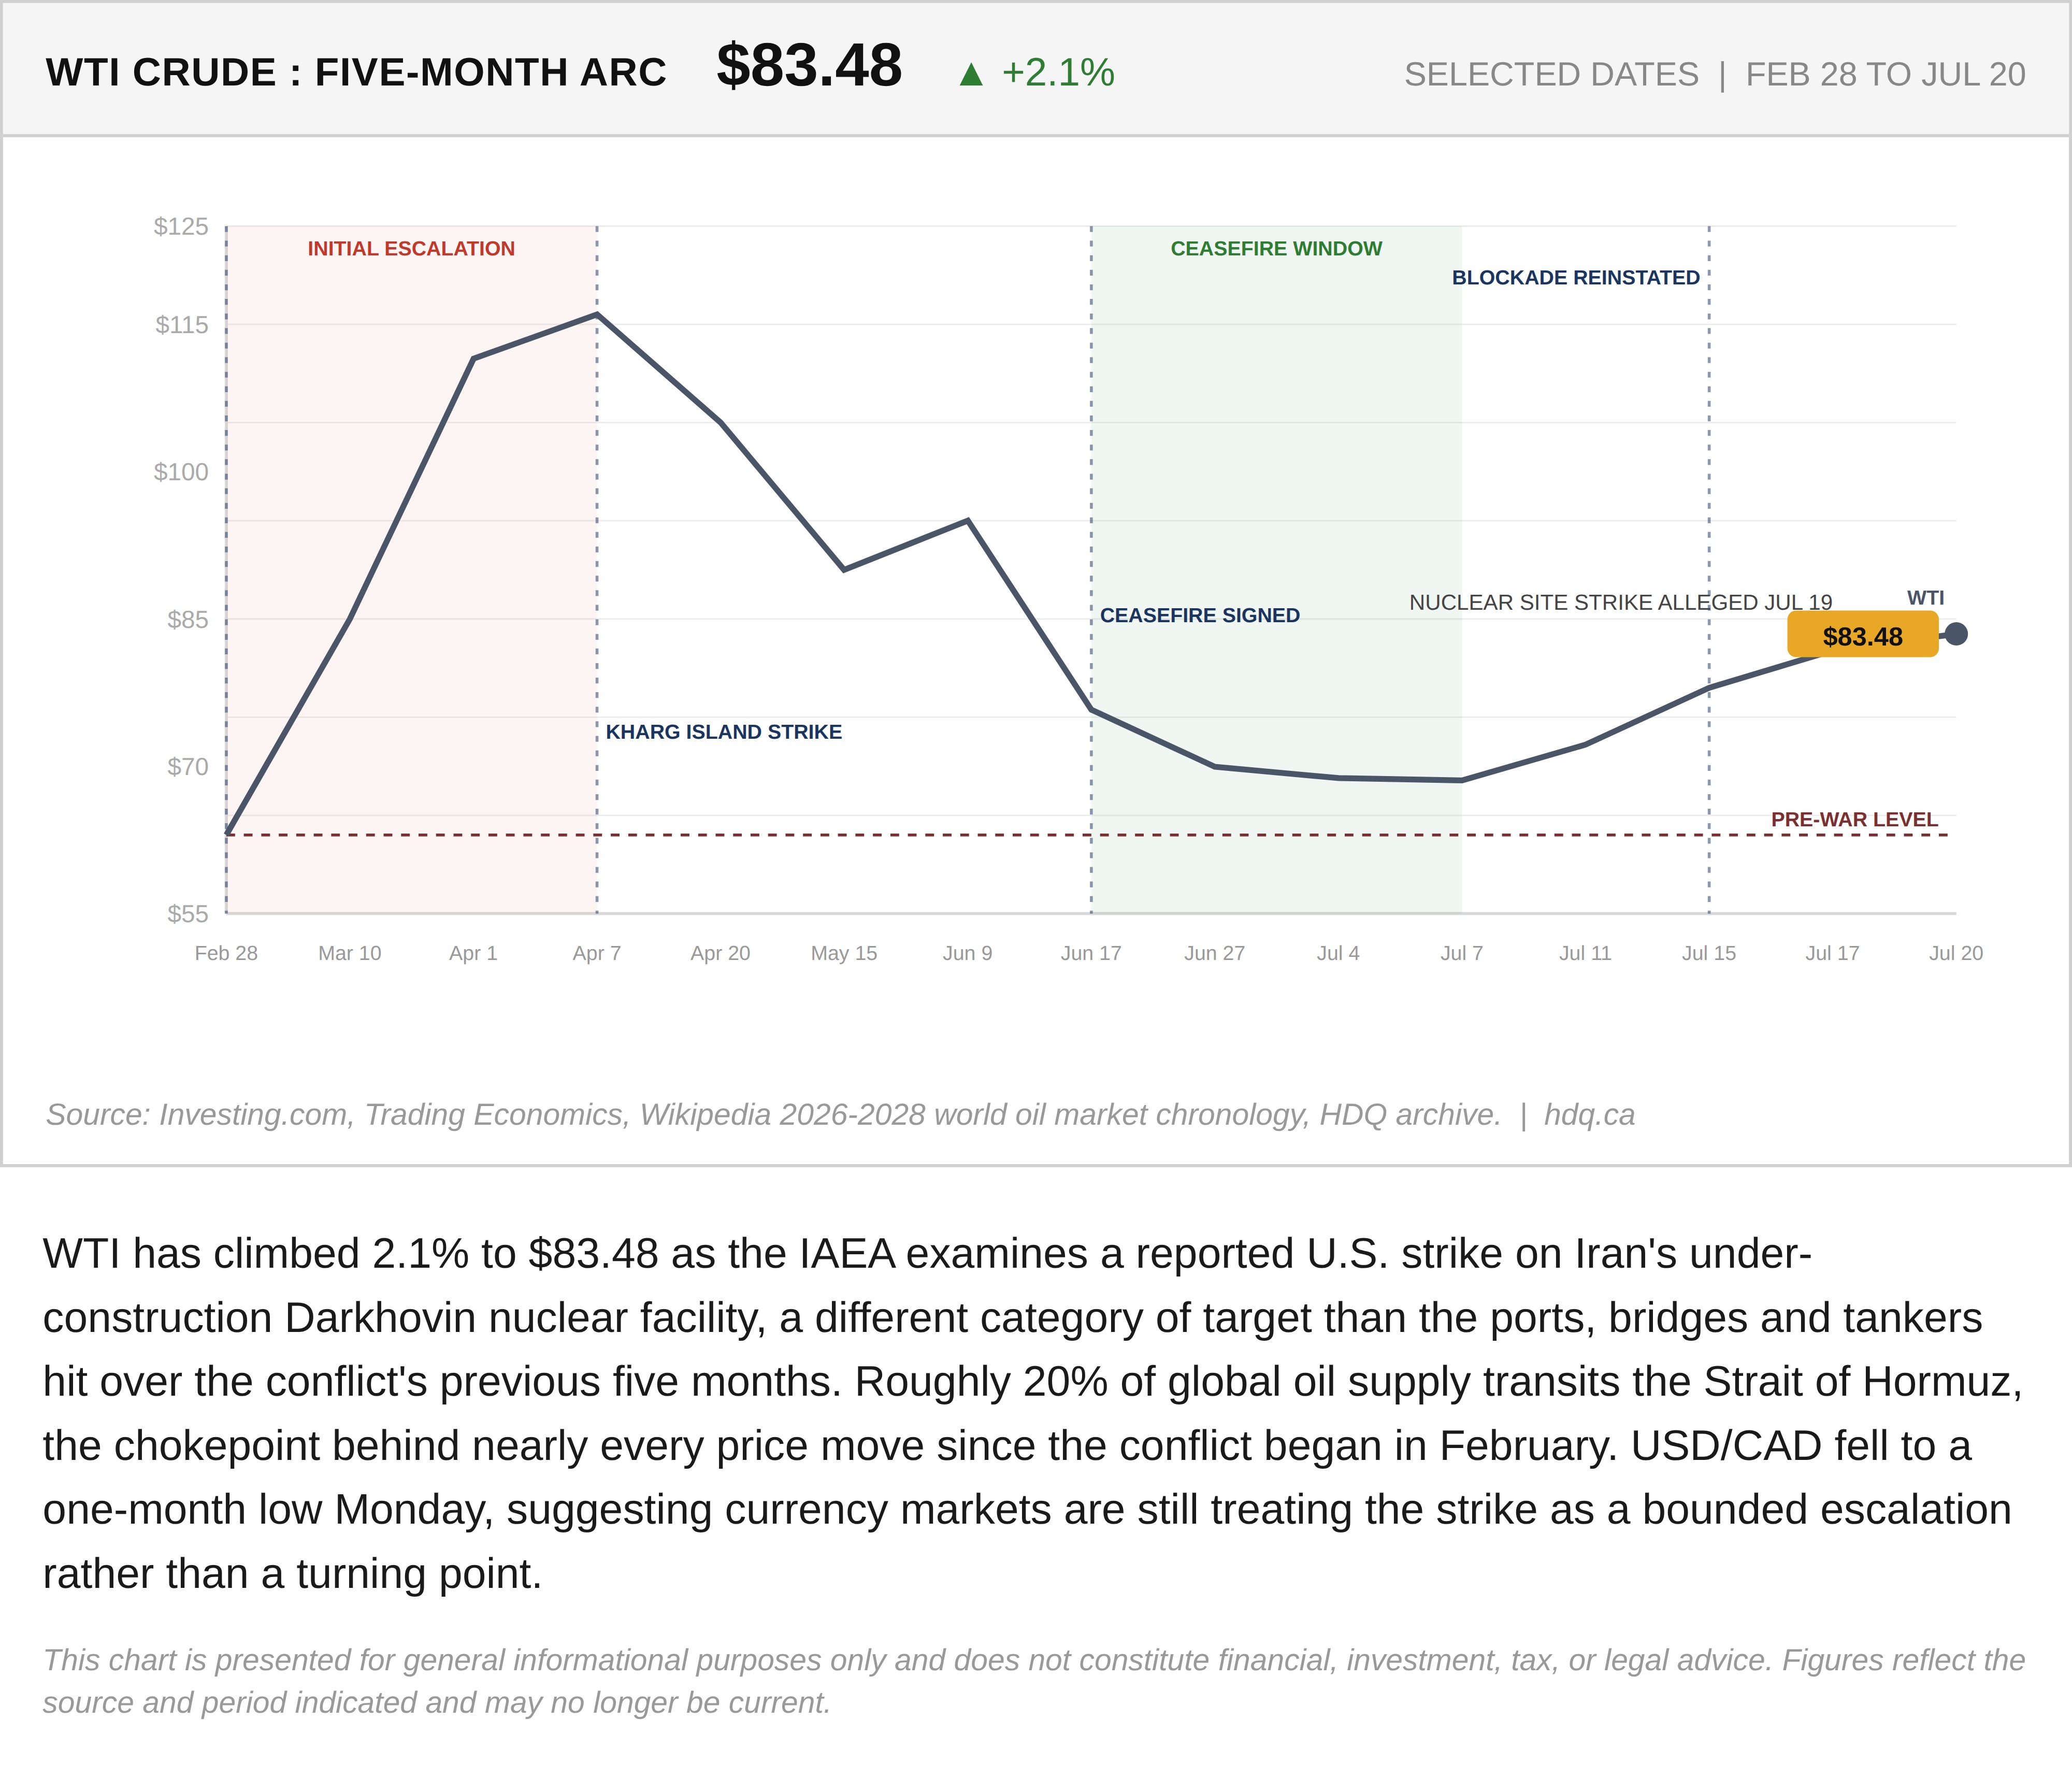
WTI has climbed 2.1% to $83.48 as the IAEA examines a reported U.S. strike on Iran's under-construction Darkhovin nuclear facility, a different category of target than the ports, bridges and tankers hit over the conflict's previous five months. Roughly 20% of global oil supply transits the Strait of Hormuz, the chokepoint behind nearly every price move since the conflict began in February. USD/CAD fell to a one-month low Monday, suggesting currency markets are still treating the strike as a bounded escalation rather than a turning point.
This chart is presented for general informational purposes only and does not constitute financial, investment, tax, or legal advice. Figures reflect the source and period indicated and may no longer be current.

Related charts
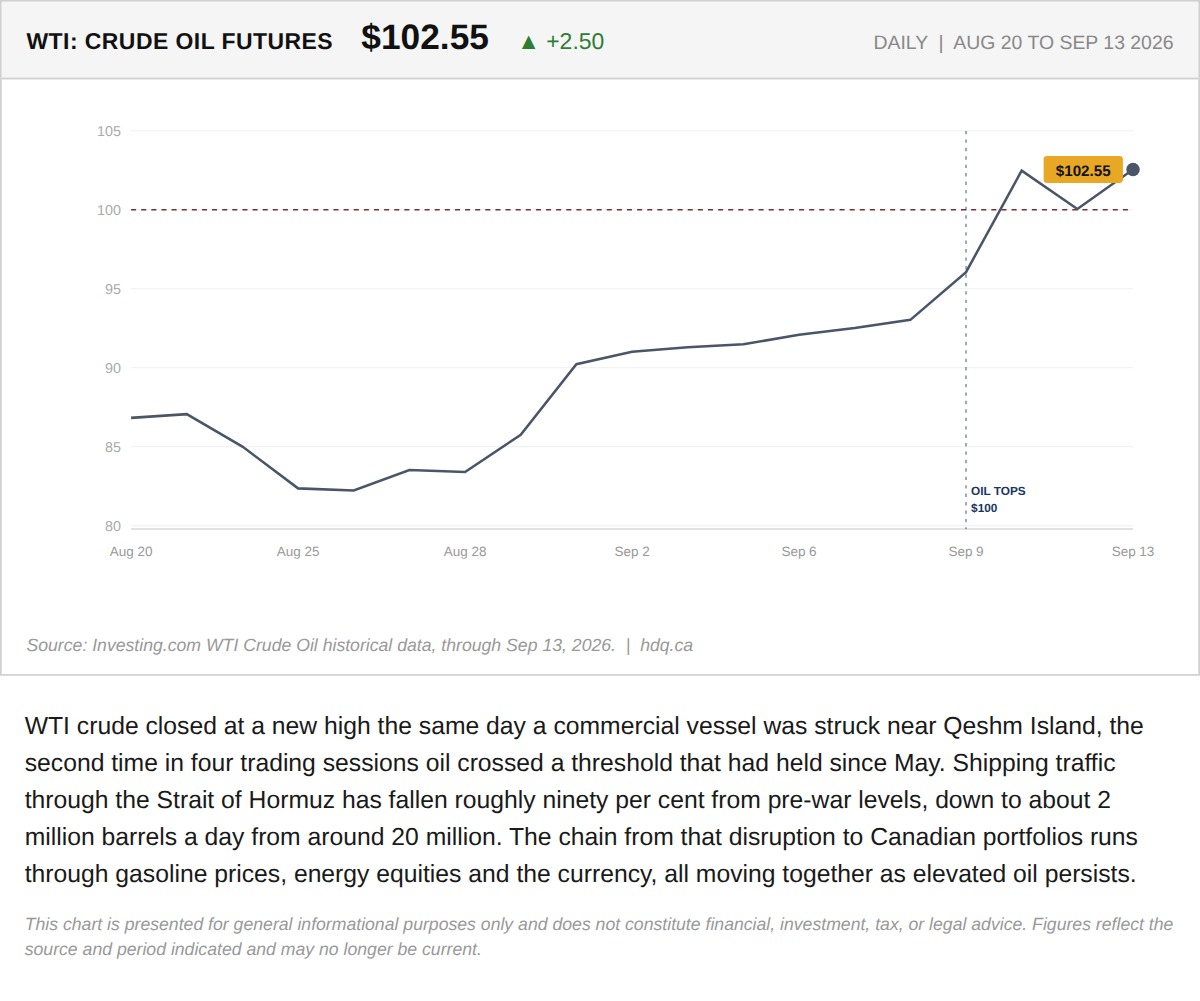
WTI crude closed at a new high the same day a commercial vessel was struck near Qeshm Island, the second time in four trading sessions oil…
A Tanker Strike Near Qeshm Island Confirms Oil Above $100 Is Not a Blip
September 14, 2026
View chart & download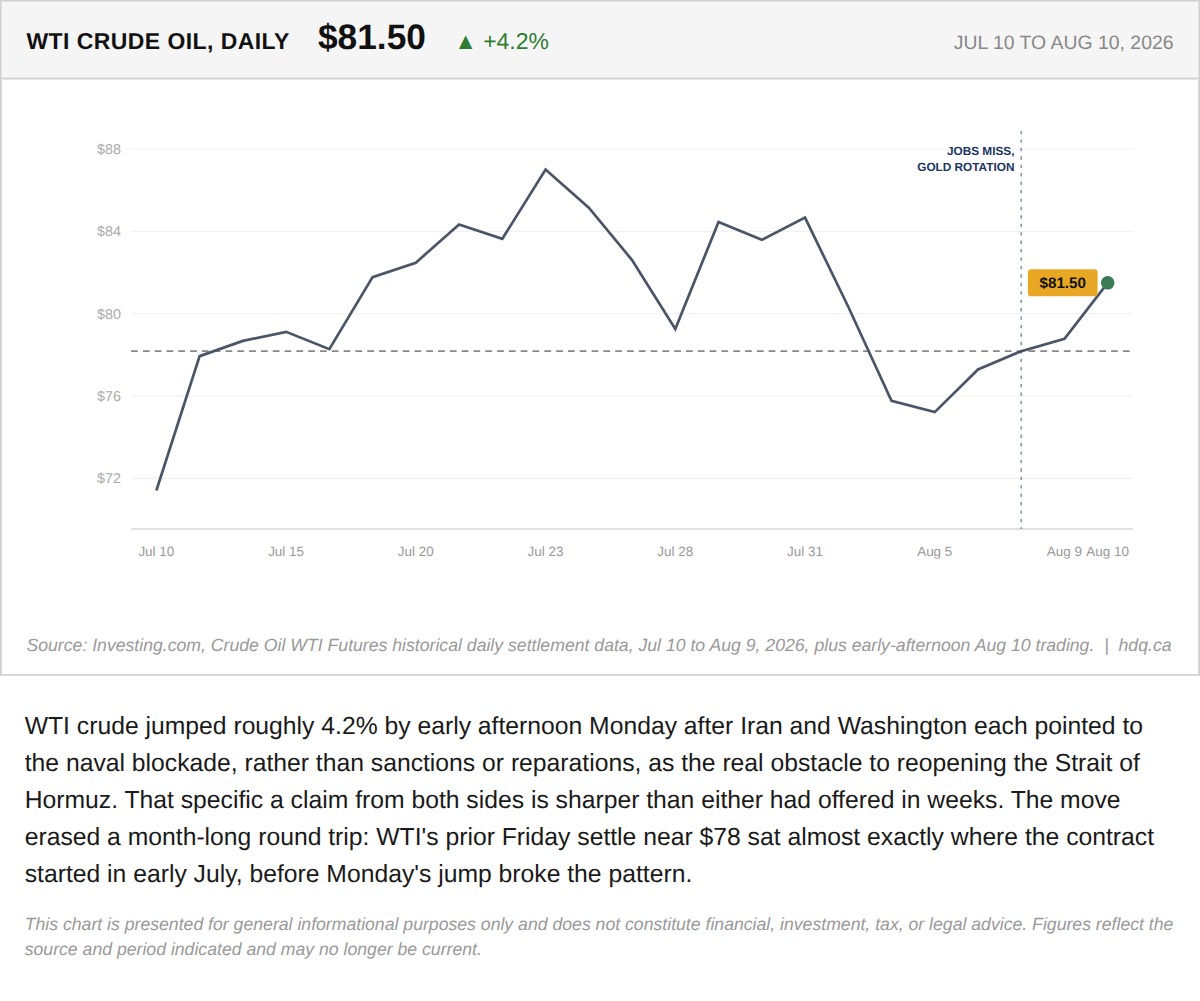
WTI crude jumped roughly 4.2% by early afternoon Monday after Iran and Washington each pointed to the naval blockade, rather than sanctions…
WTI Crude Oil Jumps as Hormuz Naval Blockade Named the Real Sticking Point
August 10, 2026
View chart & download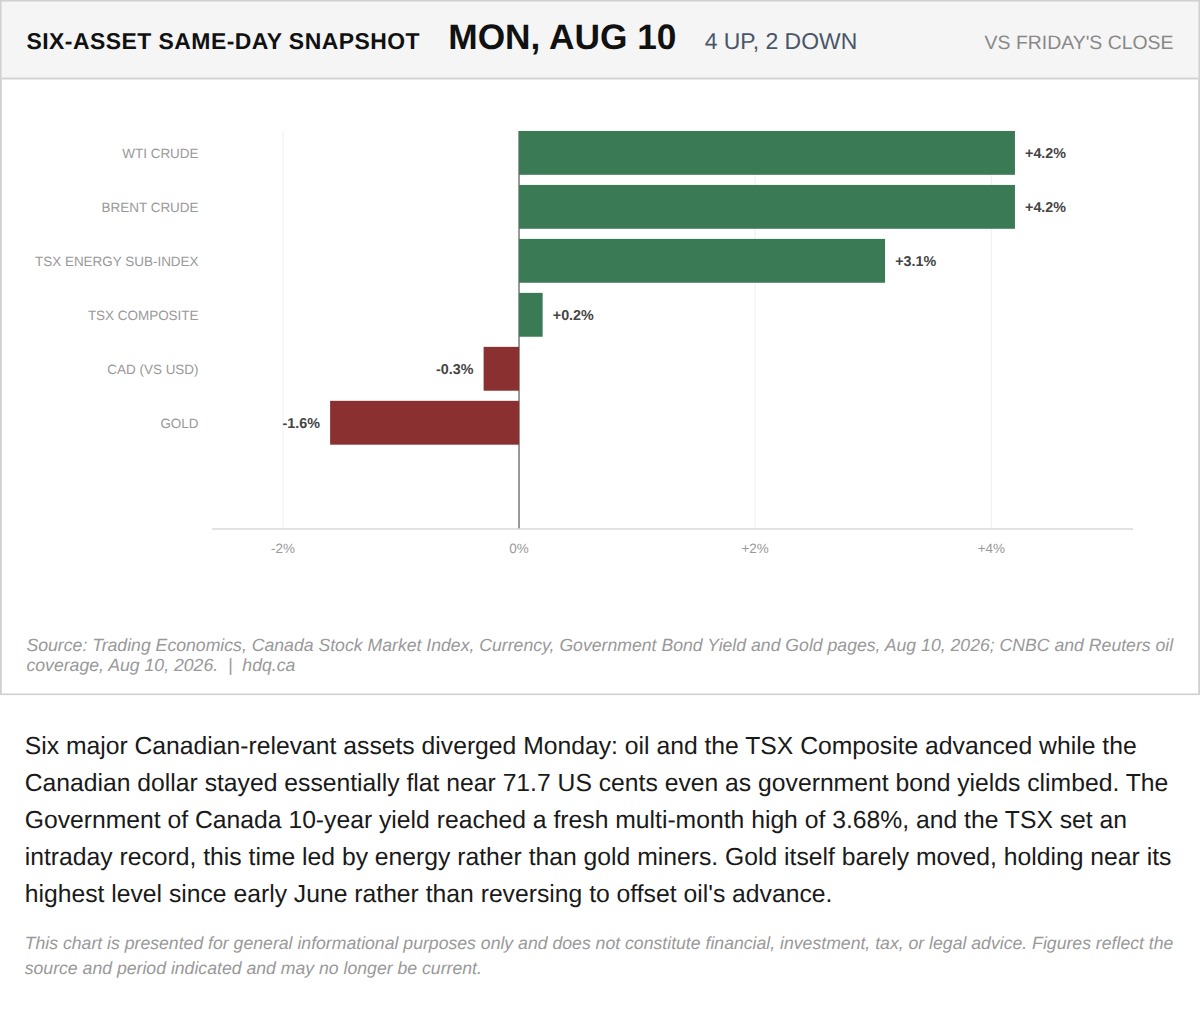
Six major Canadian-relevant assets diverged Monday: oil and the TSX Composite advanced while the Canadian dollar stayed essentially flat…
Six Assets, One Session: Oil and the TSX Rally While the Loonie and Gold Stay Flat
August 10, 2026
View chart & download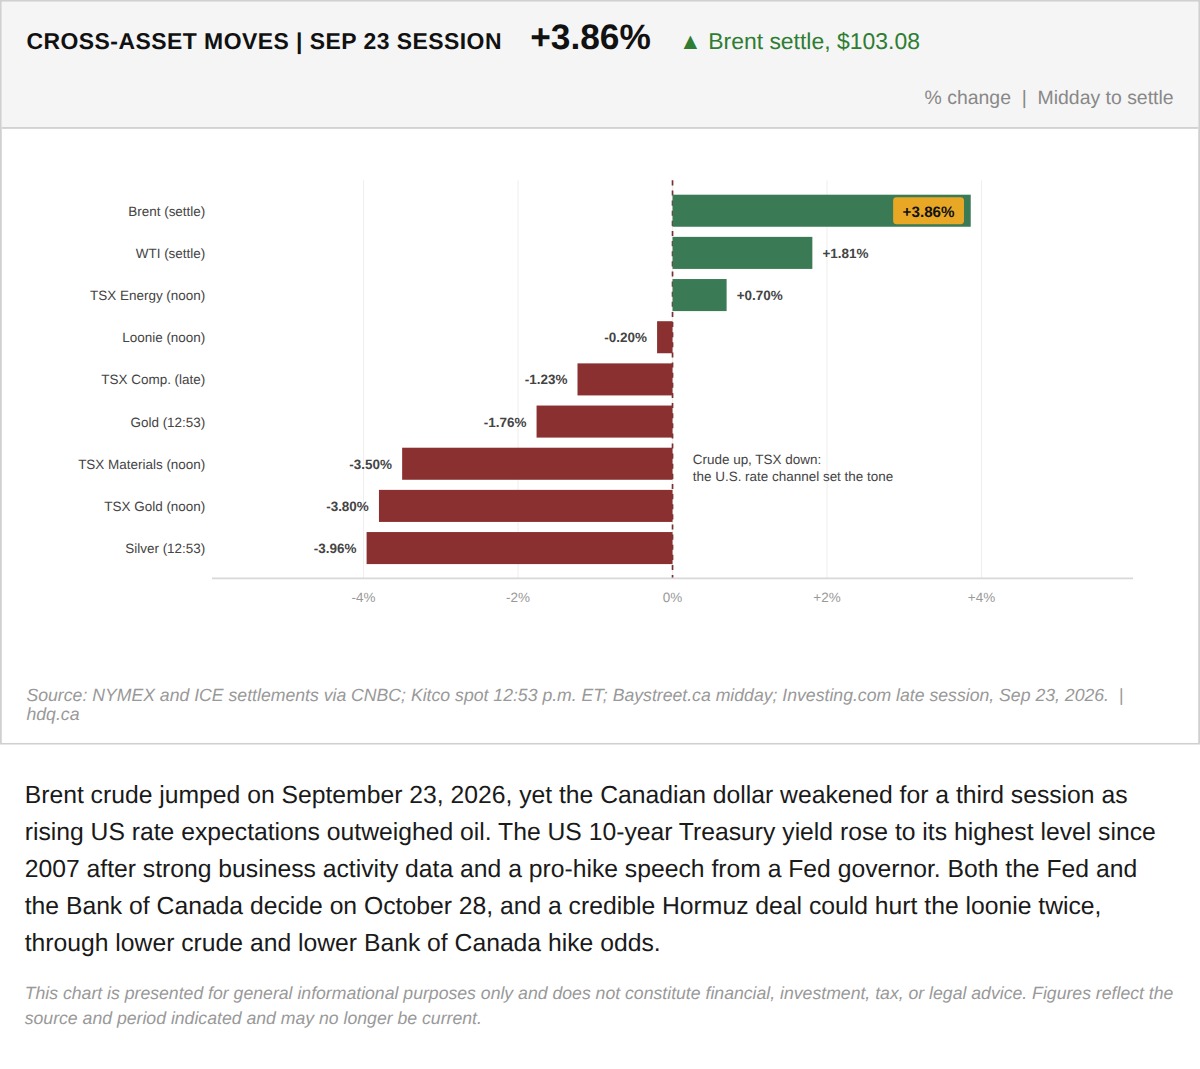
Brent crude jumped on September 23, 2026, yet the Canadian dollar weakened for a third session as rising US rate expectations outweighed oil.
Brent Jumps While the Canadian Dollar and TSX Fall in the September 23 Session
September 23, 2026
View chart & download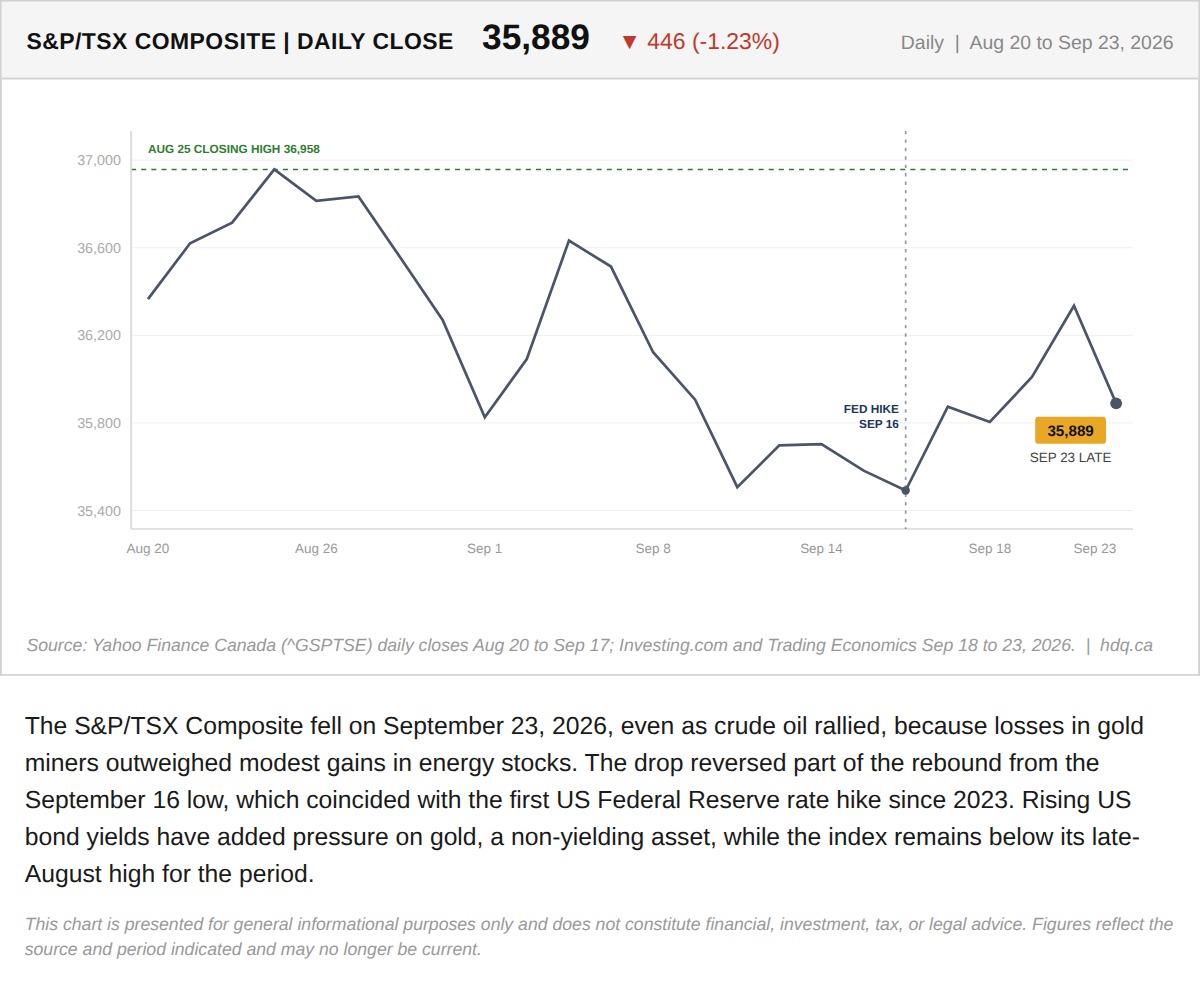
The S&P/TSX Composite fell on September 23, 2026, even as crude oil rallied, because losses in gold miners outweighed modest gains in energy stocks.
TSX Composite Falls Despite an Oil Rally as Gold Stocks Slide
September 23, 2026
View chart & download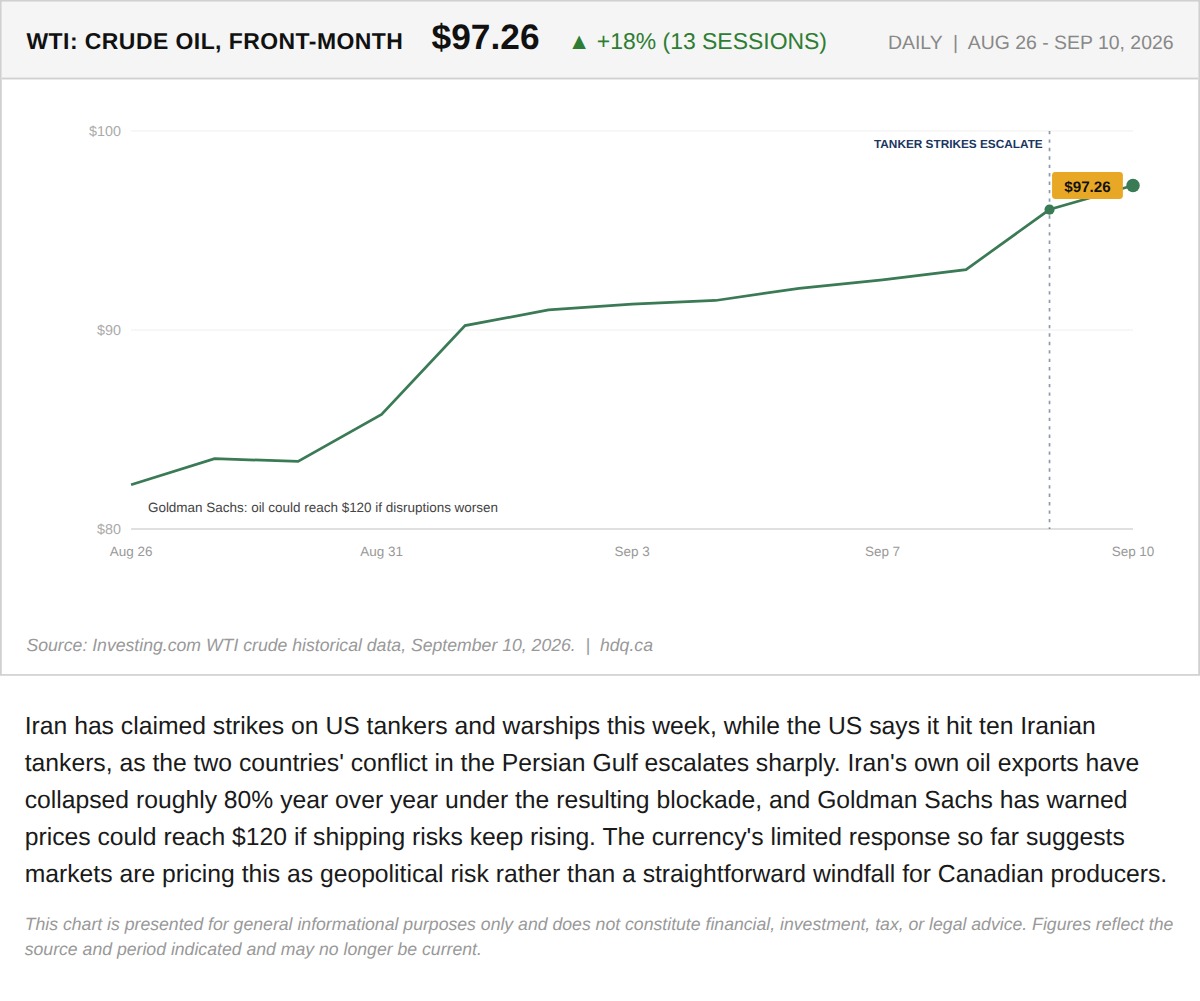
Iran has claimed strikes on US tankers and warships this week, while the US says it hit ten Iranian tankers, as the two countries' conflict in the Persian Gulf escalates sharply.
The Tanker War Sent Oil Up 18%. The Canadian Dollar's Muted Response Is the Signal to Watch
September 10, 2026
View chart & download