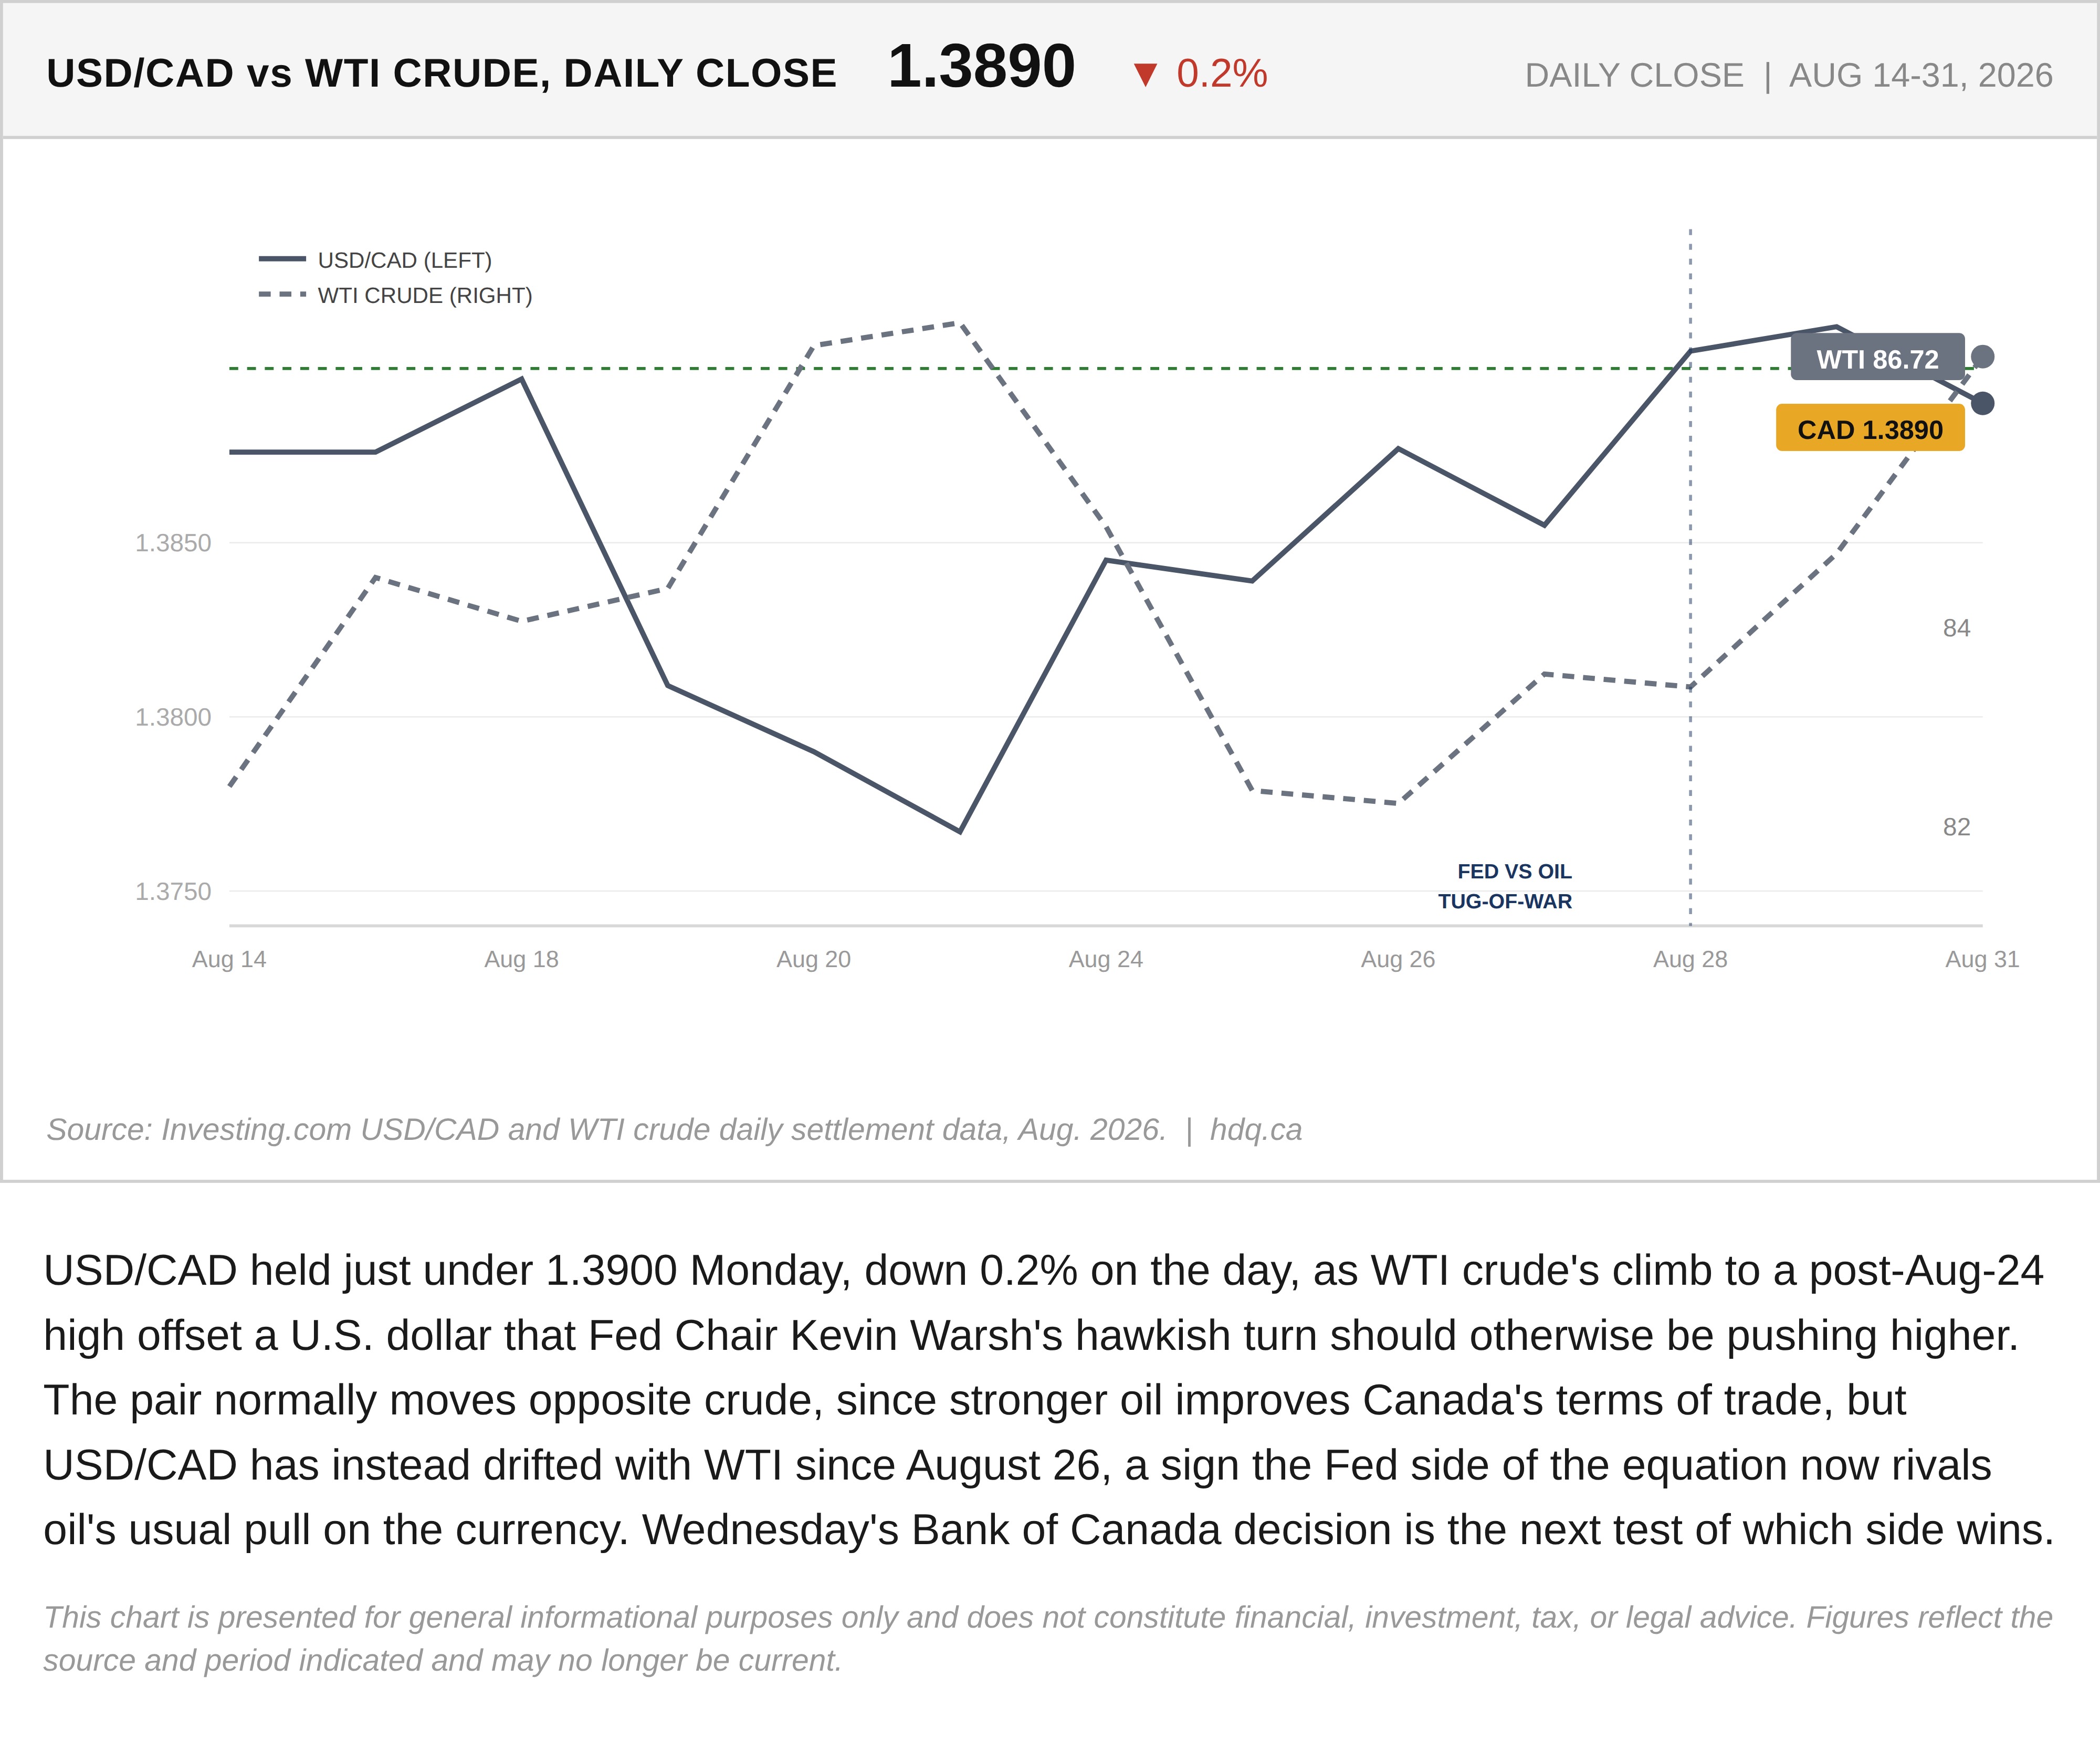
USD/CAD held just under 1.3900 Monday, down 0.2% on the day, as WTI crude's climb to a post-Aug-24 high offset a U.S. dollar that Fed Chair Kevin Warsh's hawkish turn should otherwise be pushing higher. The pair normally moves opposite crude, since stronger oil improves Canada's terms of trade, but USD/CAD has instead drifted with WTI since August 26, a sign the Fed side of the equation now rivals oil's usual pull on the currency. Wednesday's Bank of Canada decision is the next test of which side wins.
This chart is presented for general informational purposes only and does not constitute financial, investment, tax, or legal advice. Figures reflect the source and period indicated and may no longer be current.
Related charts
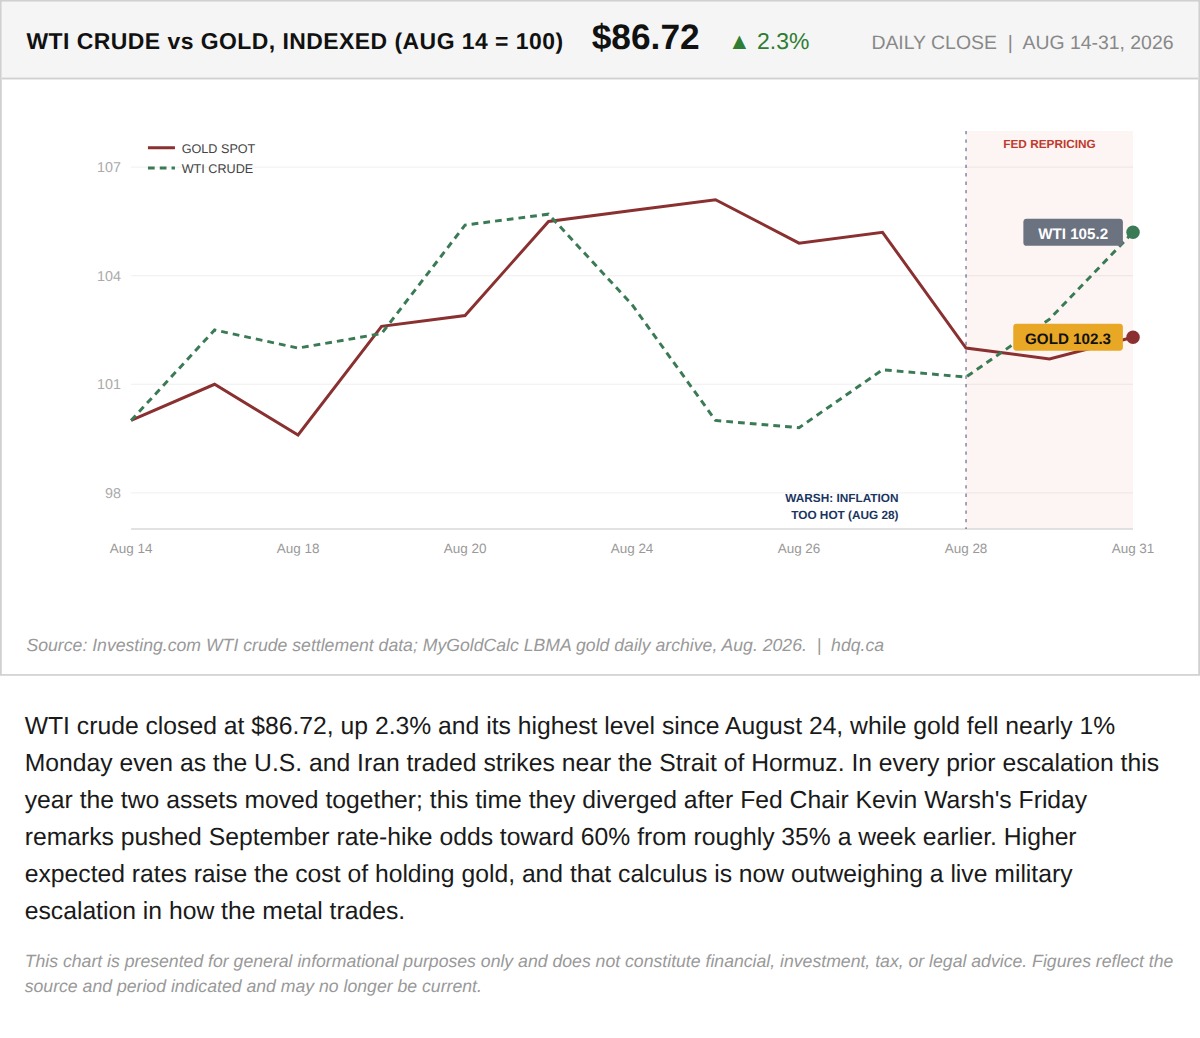
WTI crude closed at $86.72, up 2.3% and its highest level since August 24, while gold fell nearly 1% Monday even as the U.S.
Gold's Silence on the Iran Strikes Points Straight at Wednesday's BoC Decision
August 31, 2026
View chart & download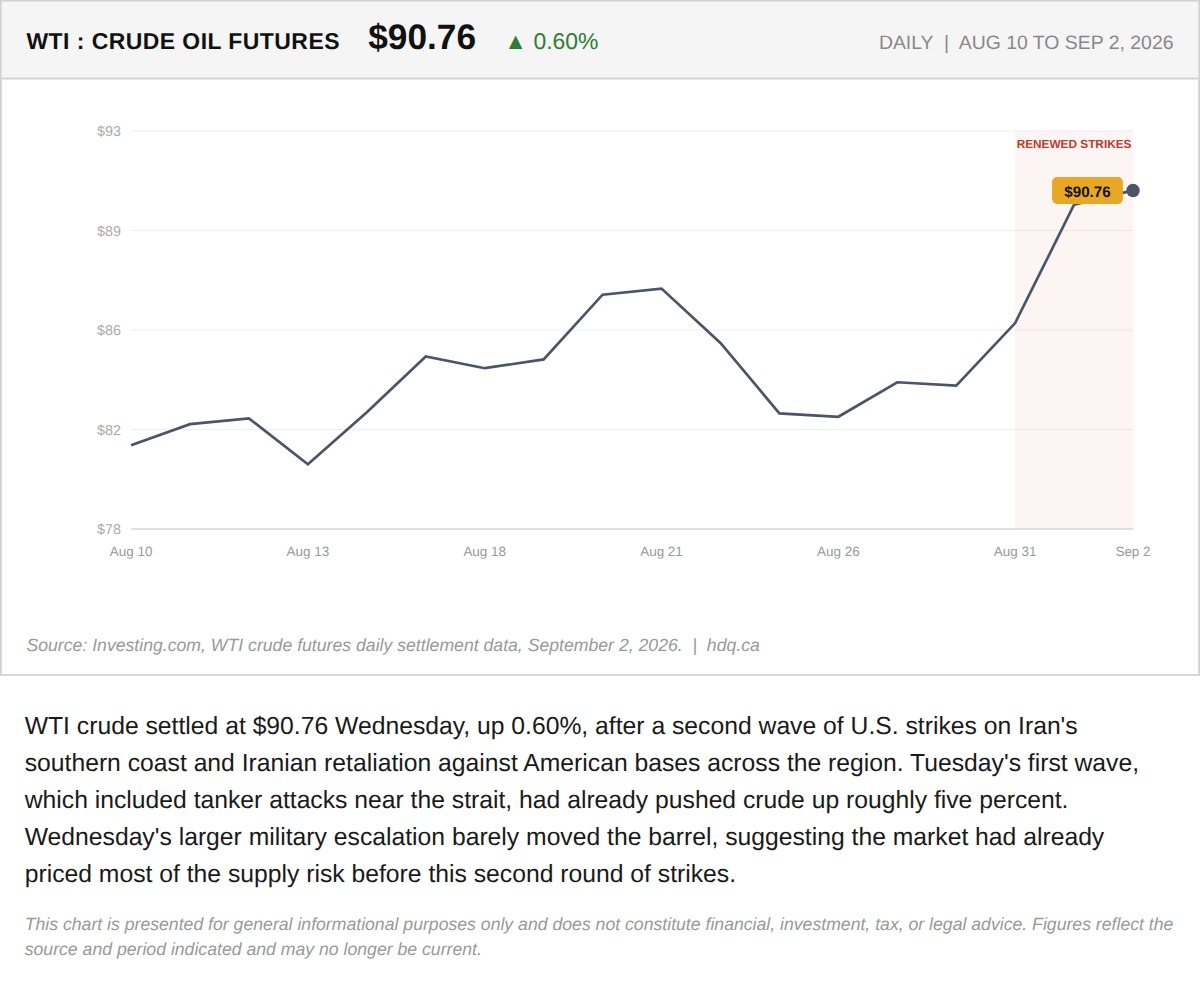
WTI crude settled at $90.76 Wednesday, up 0.60%, after a second wave of U.S.
WTI Crude Adds 0.60% as a Second Wave of Strikes Near Iran Barely Moves the Barrel
September 2, 2026
View chart & download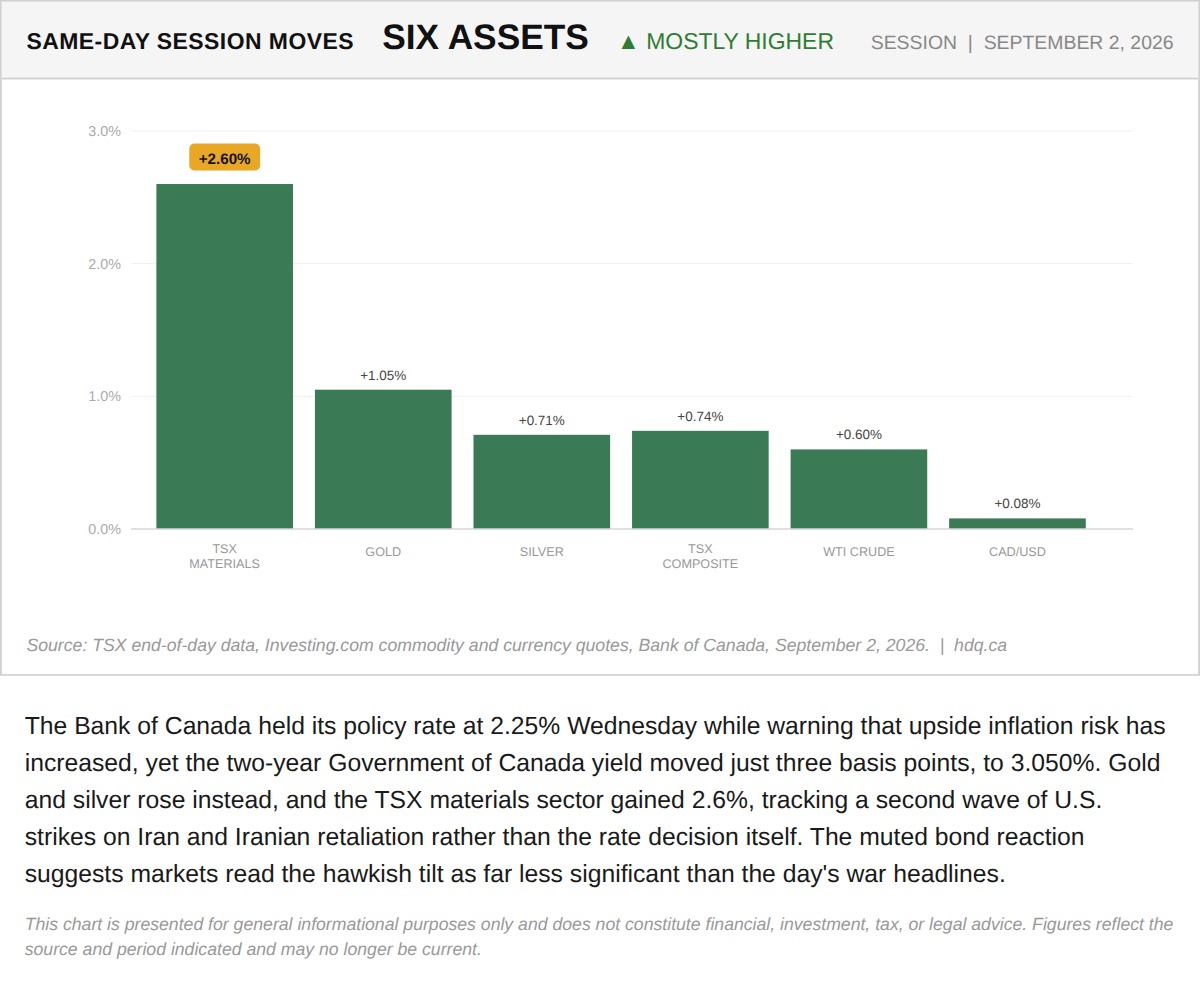
The Bank of Canada held its policy rate at 2.25% Wednesday while warning that upside inflation risk has increased, yet the two-year…
TSX Materials, Gold and Silver Lead a Broad Same-Day Rally Across Six Assets
September 2, 2026
View chart & download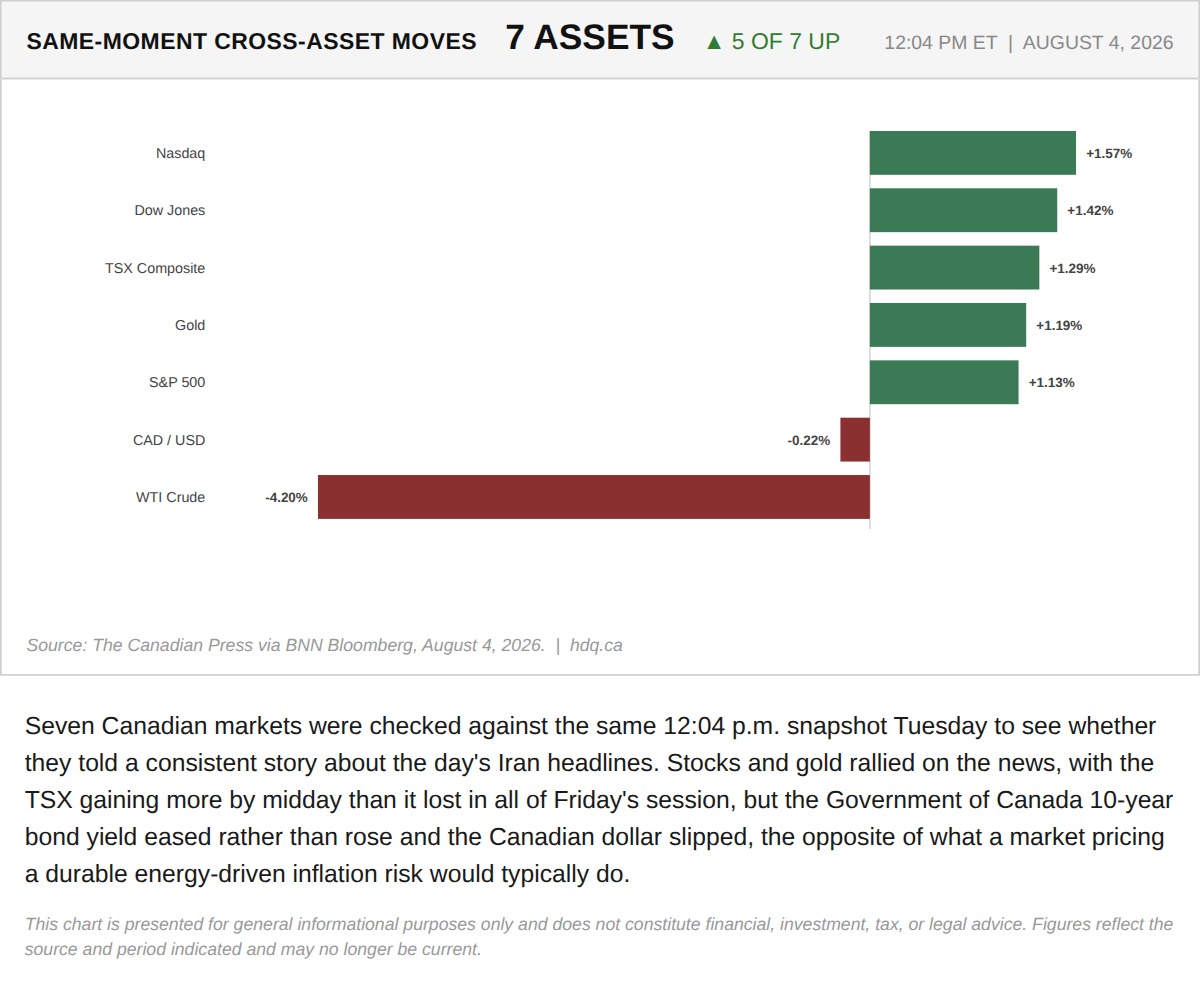
Seven Canadian markets were checked against the same 12:04 p.m.
Stocks and Gold Believed Tuesday's Iran Story. Bonds and the Loonie Did Not.
August 4, 2026
View chart & download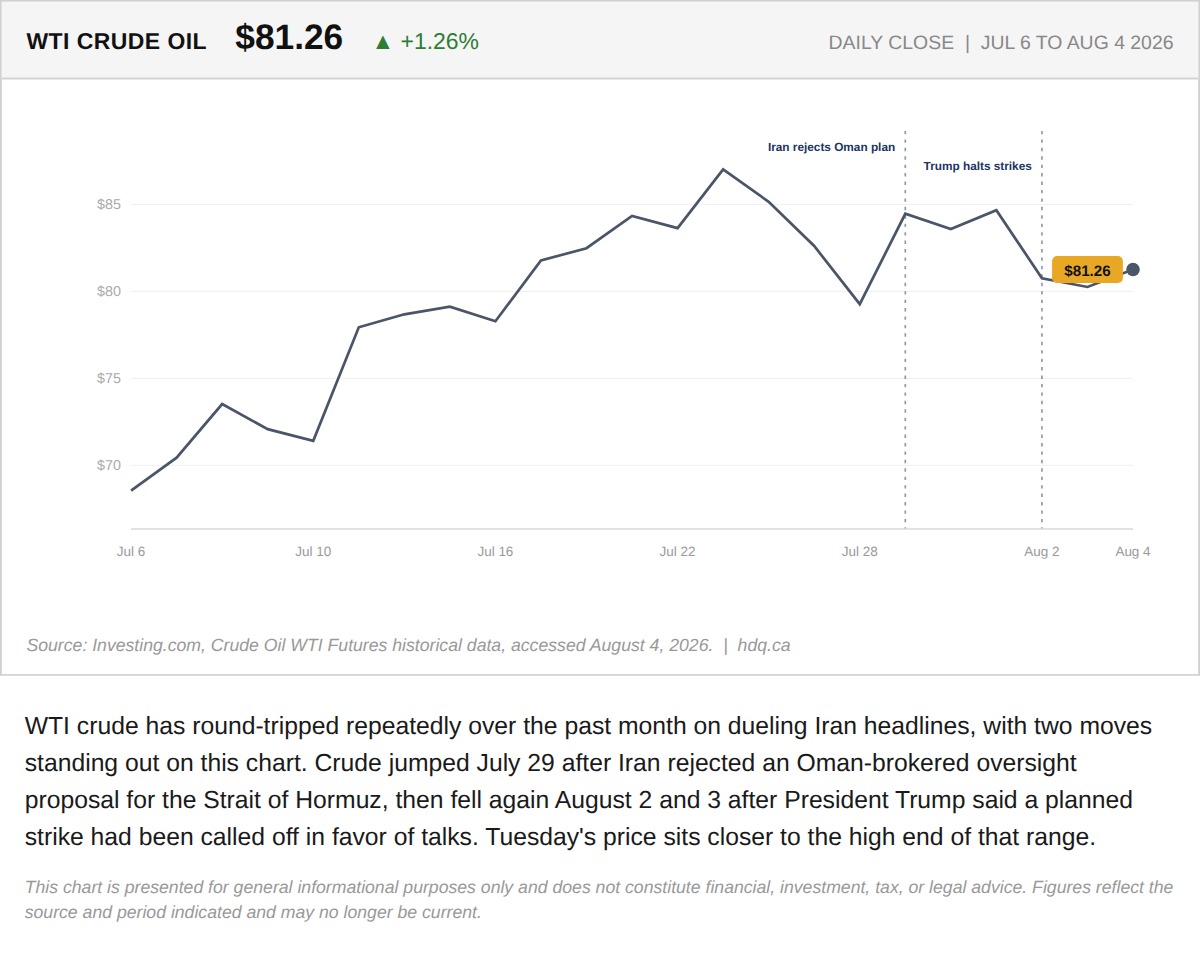
WTI crude has round-tripped repeatedly over the past month on dueling Iran headlines, with two moves standing out on this chart.
WTI Crude's Round Trip: Rejection, Rally, Reversal
August 4, 2026
View chart & download
The S&P/TSX Composite closed July at 35,226, up 1.06% for the month, a modest headline figure that conceals sharp intra-month swings.
S&P/TSX Composite closes July up 1.06% after a volatile month
July 31, 2026
View chart & download