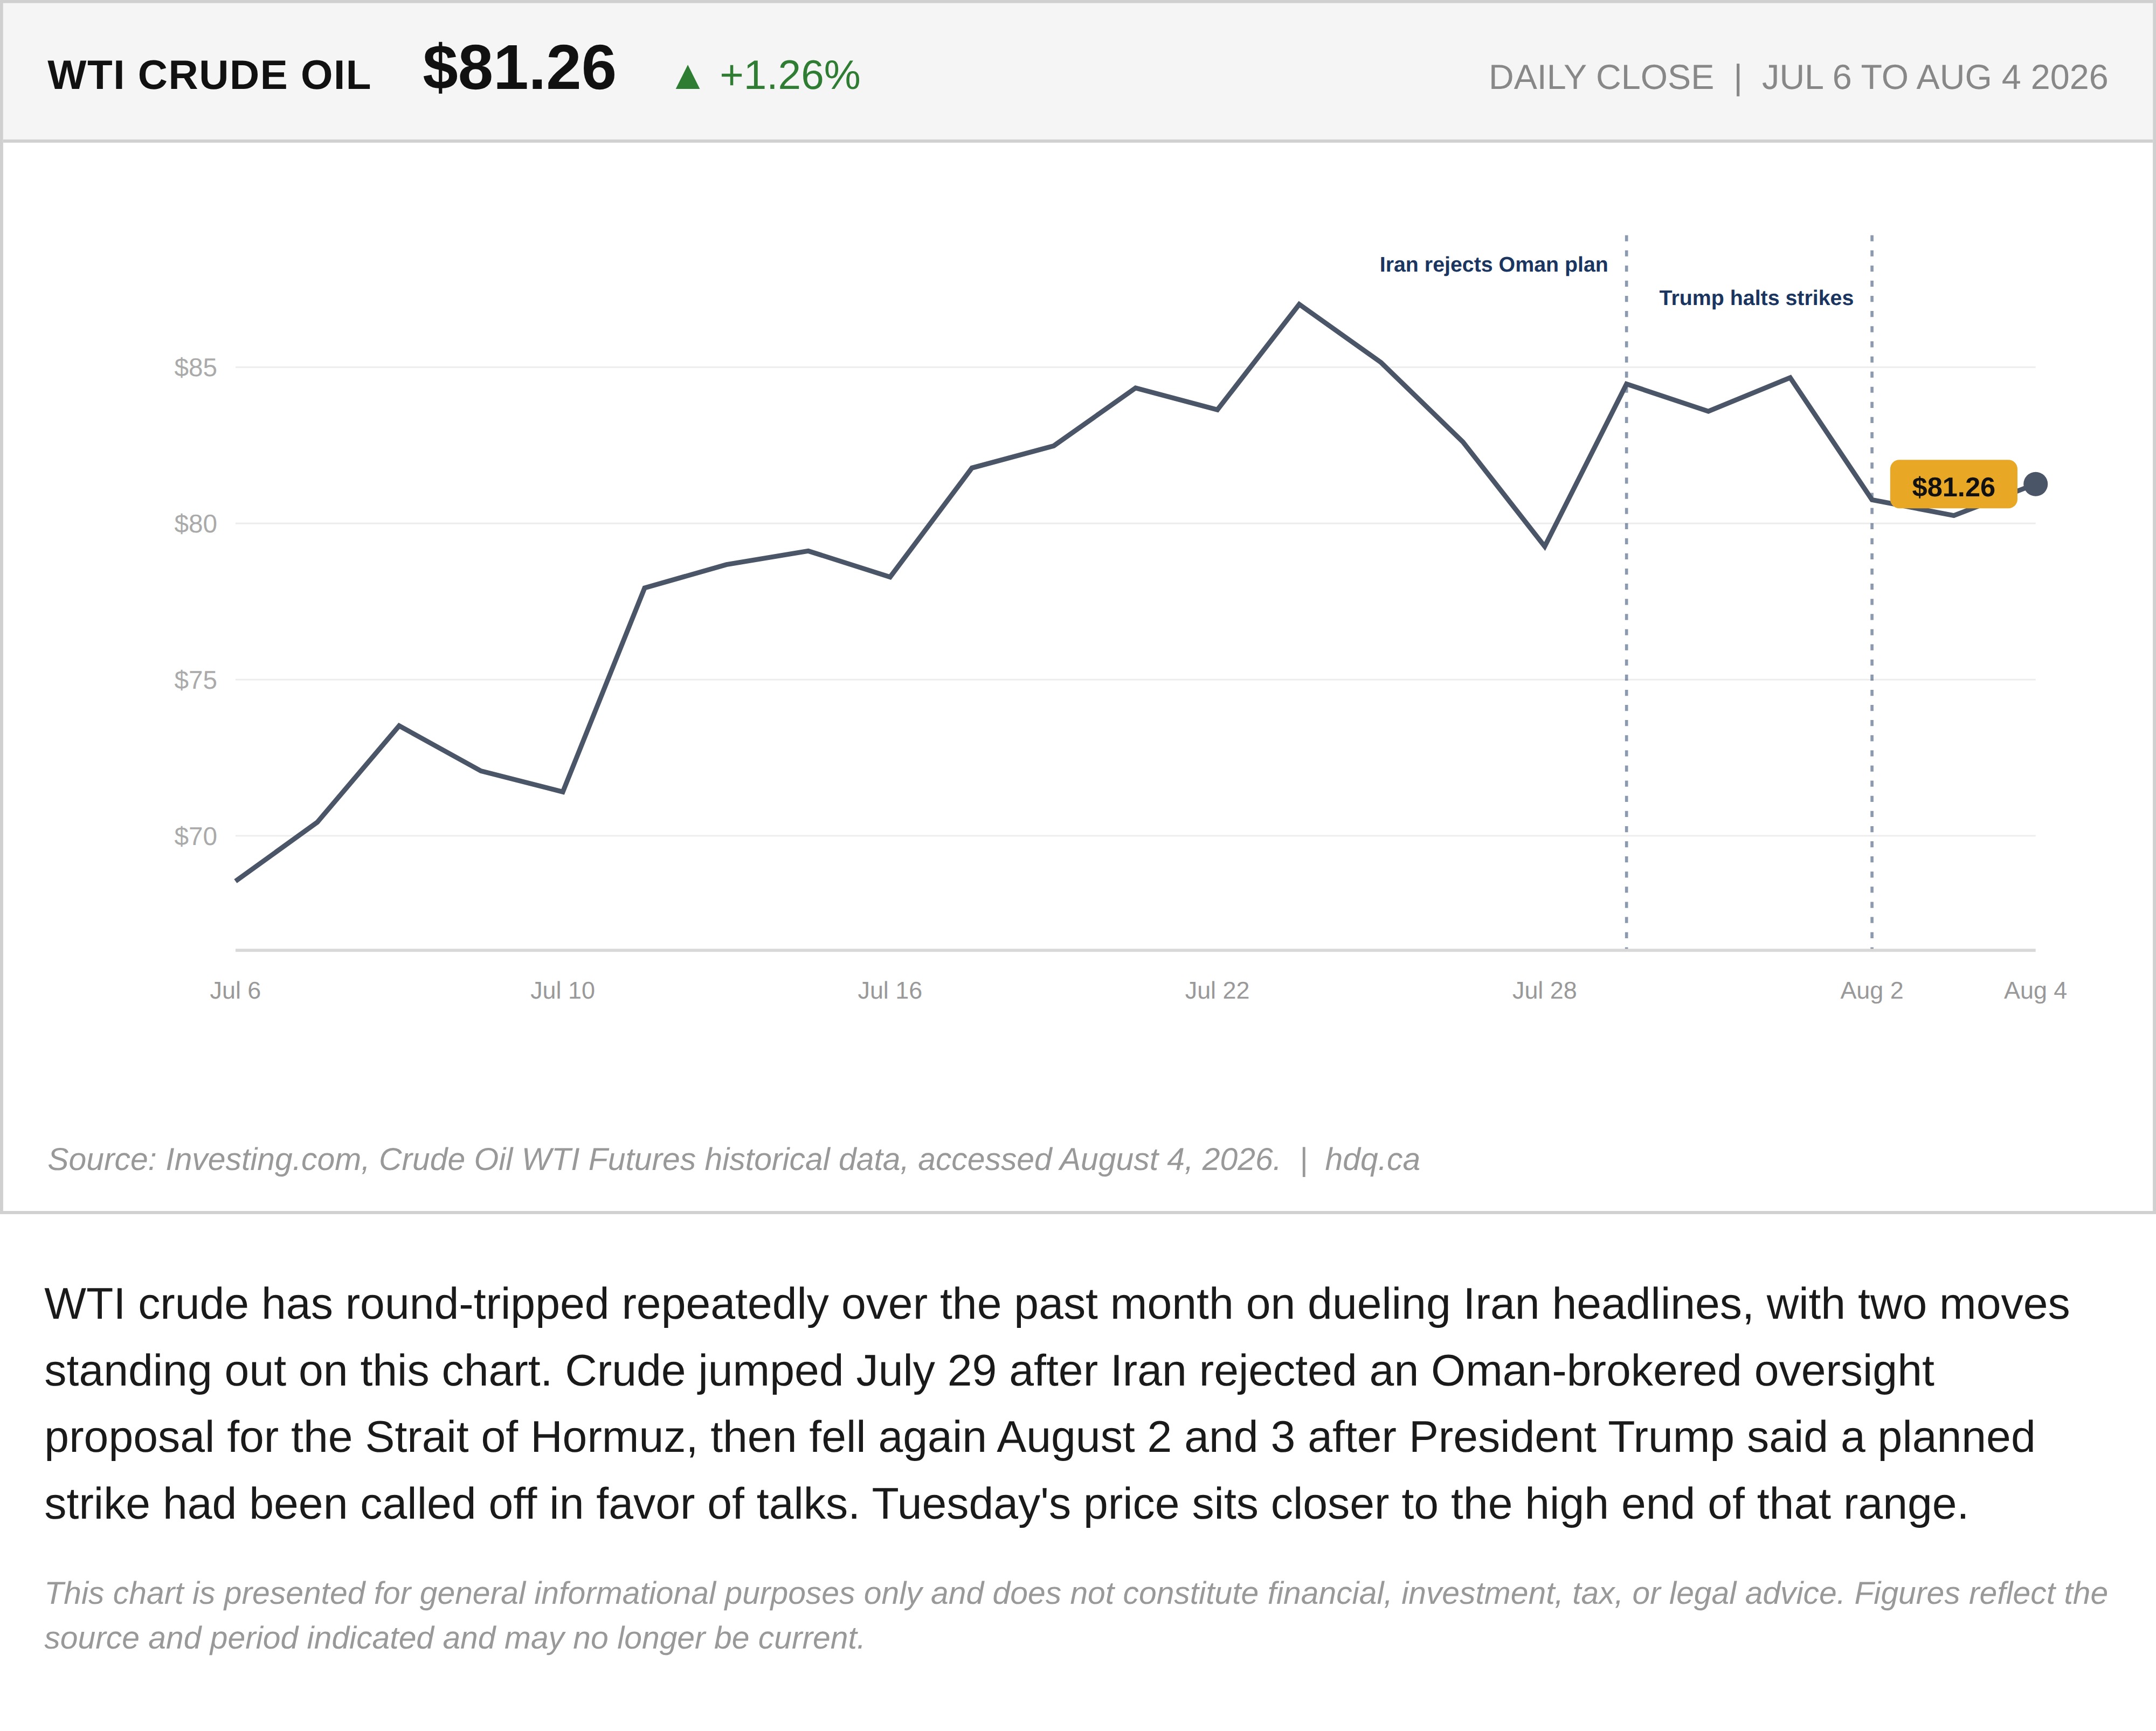
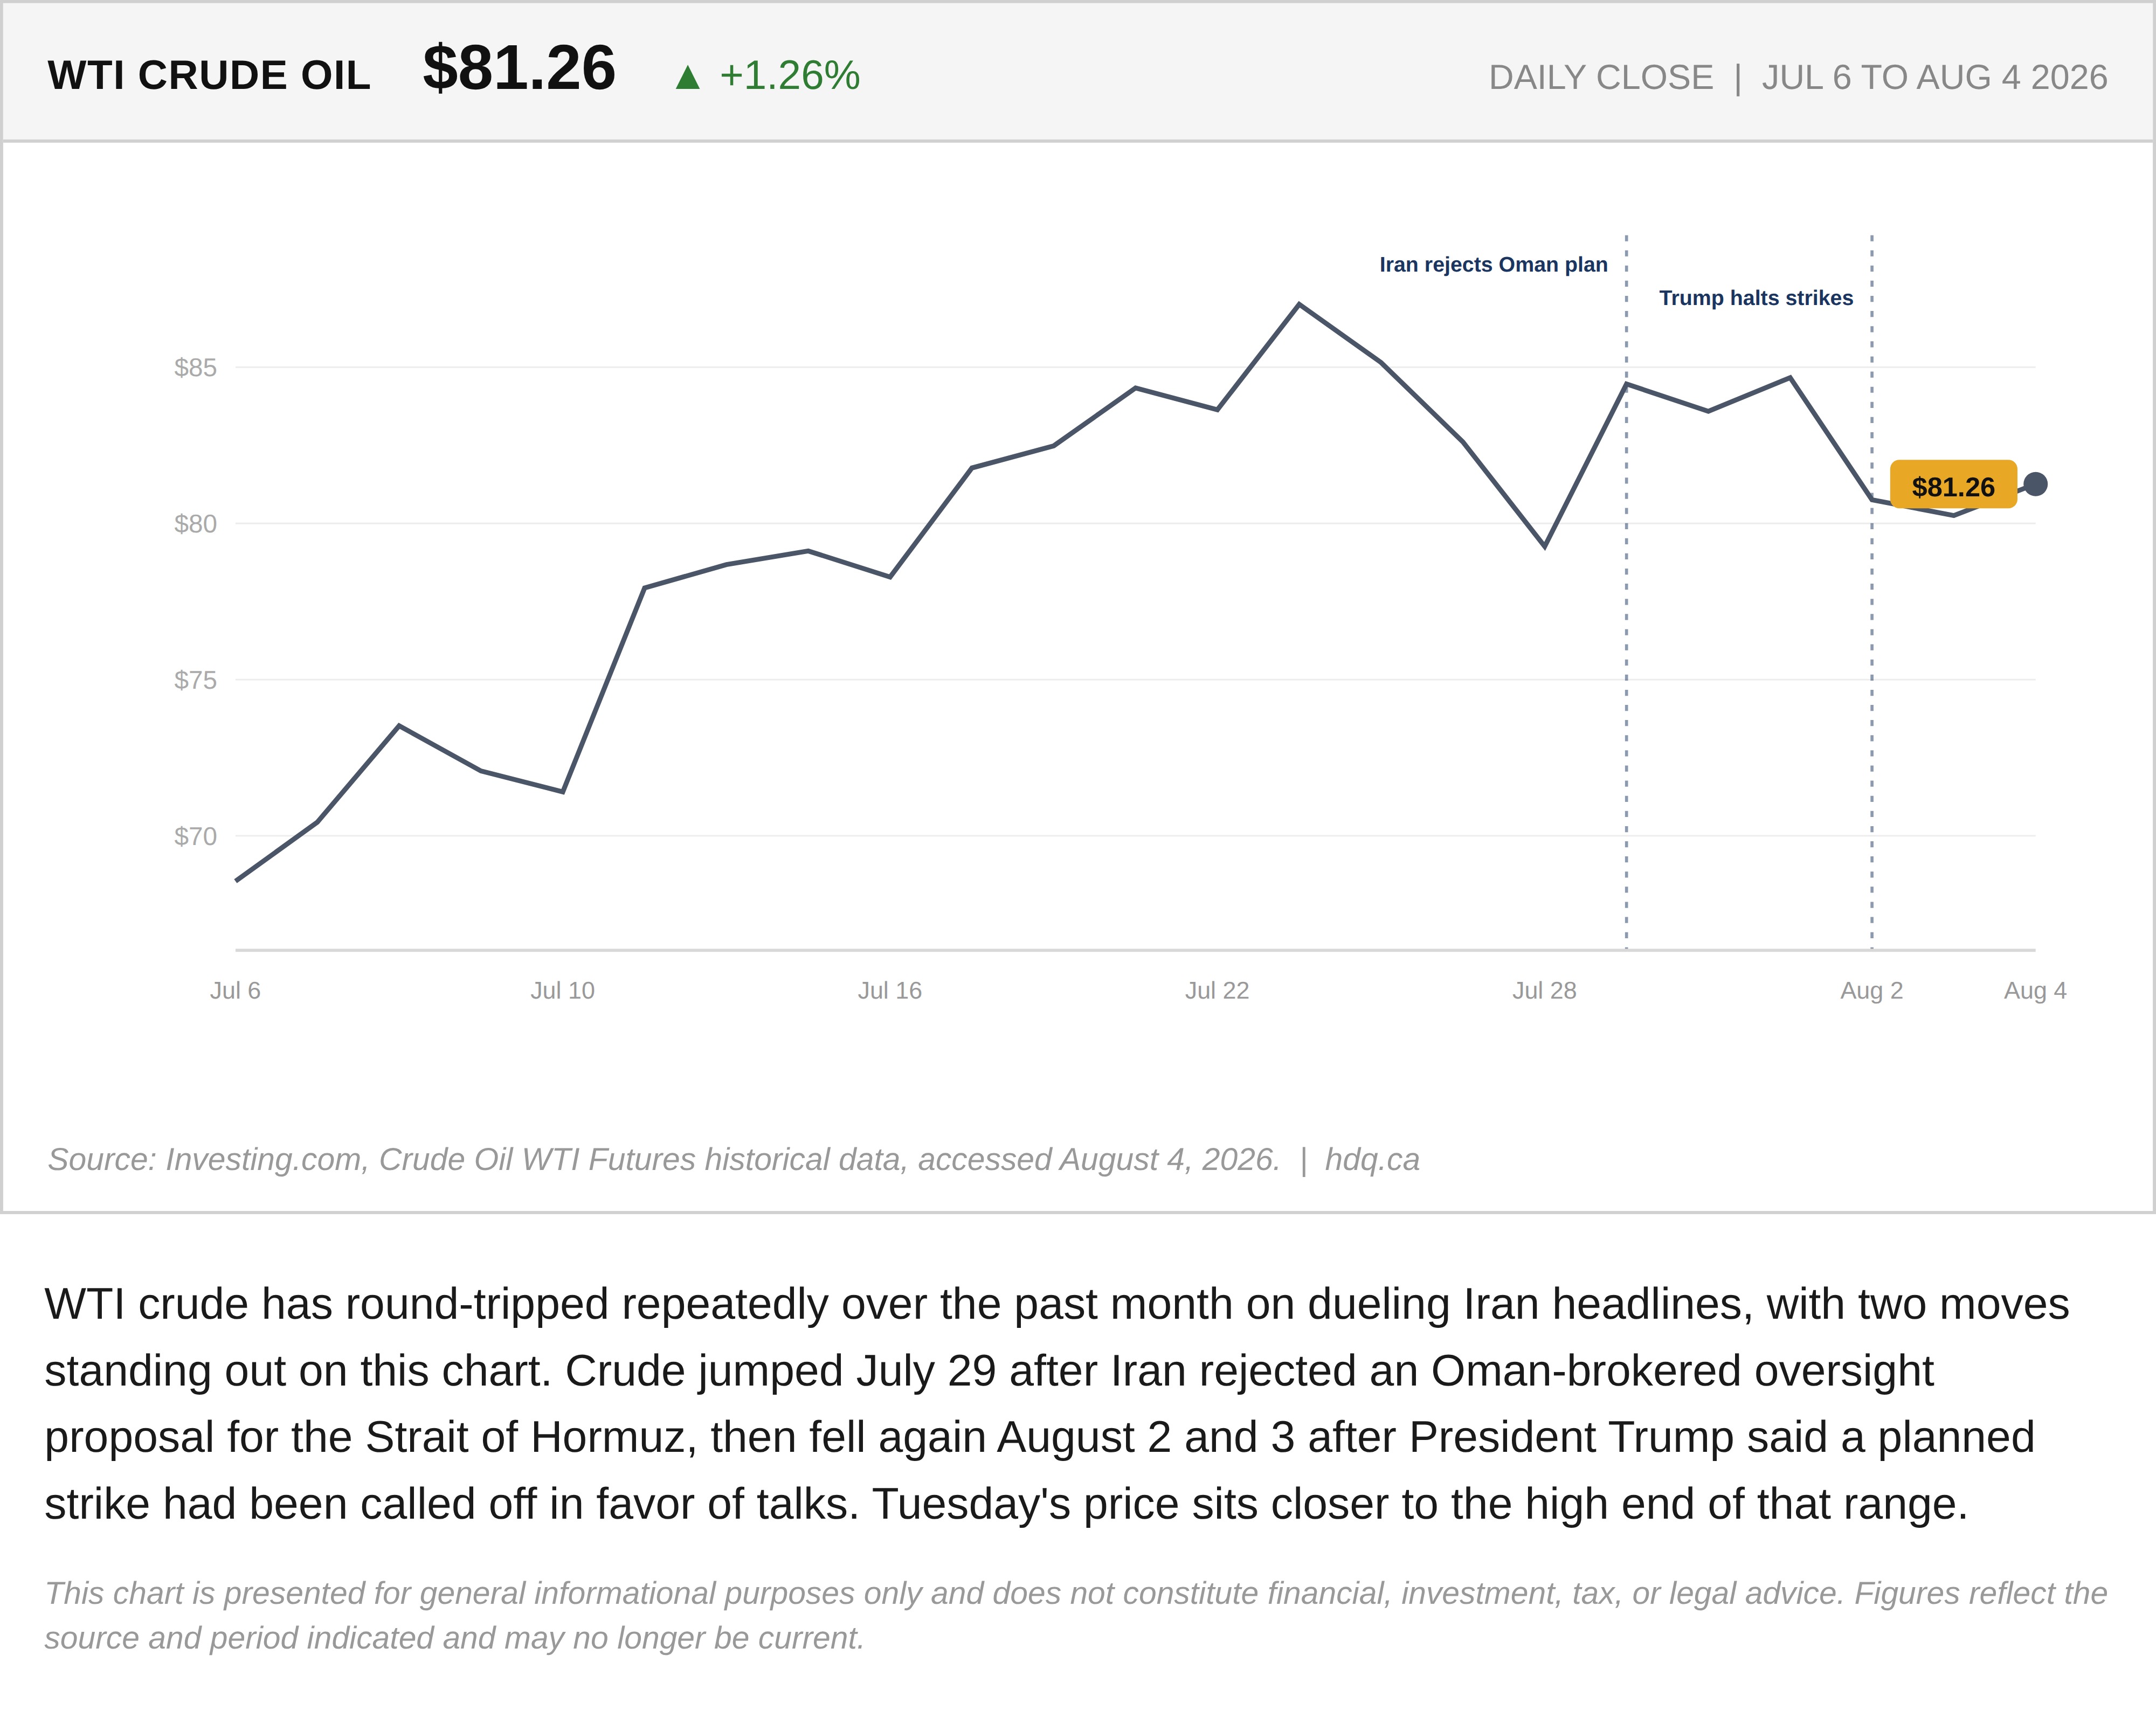
WTI crude has round-tripped repeatedly over the past month on dueling Iran headlines, with two moves standing out on this chart. Crude jumped July 29 after Iran rejected an Oman-brokered oversight proposal for the Strait of Hormuz, then fell again August 2 and 3 after President Trump said a planned strike had been called off in favor of talks. Tuesday's price sits closer to the high end of that range.
This chart is presented for general informational purposes only and does not constitute financial, investment, tax, or legal advice. Figures reflect the source and period indicated and may no longer be current.
Related charts
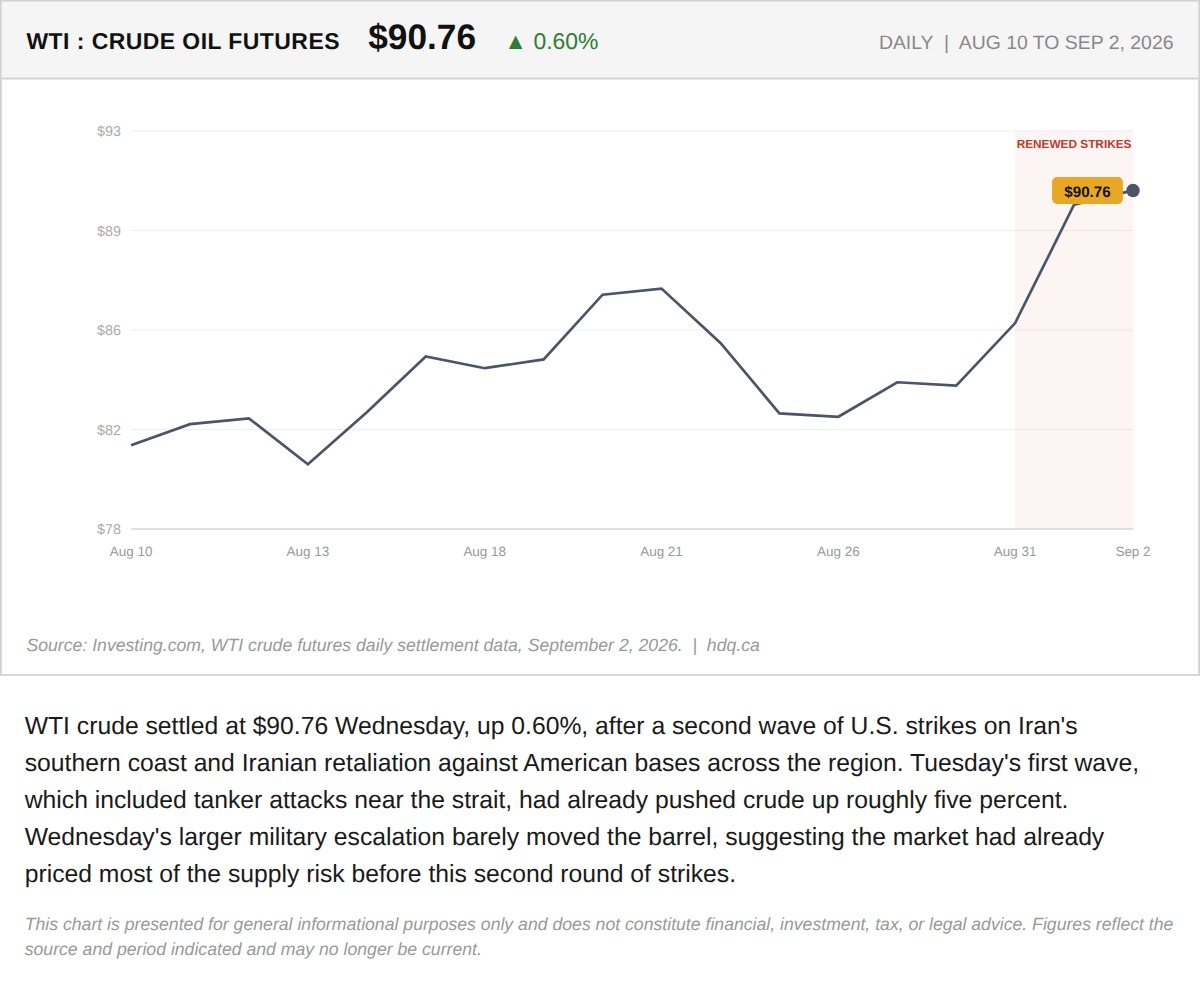
WTI crude settled at $90.76 Wednesday, up 0.60%, after a second wave of U.S.
WTI Crude Adds 0.60% as a Second Wave of Strikes Near Iran Barely Moves the Barrel
September 2, 2026
View chart & download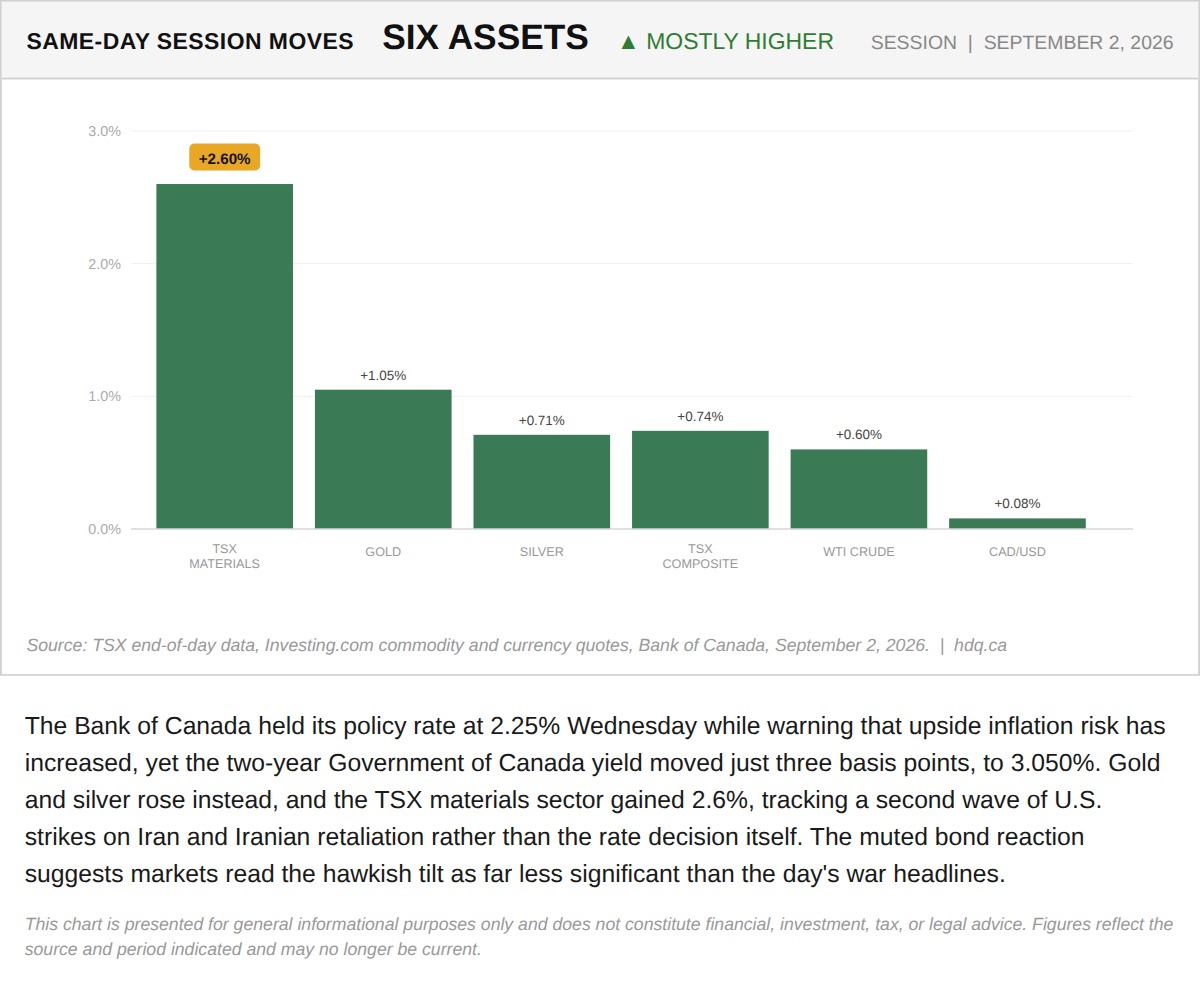
The Bank of Canada held its policy rate at 2.25% Wednesday while warning that upside inflation risk has increased, yet the two-year…
TSX Materials, Gold and Silver Lead a Broad Same-Day Rally Across Six Assets
September 2, 2026
View chart & download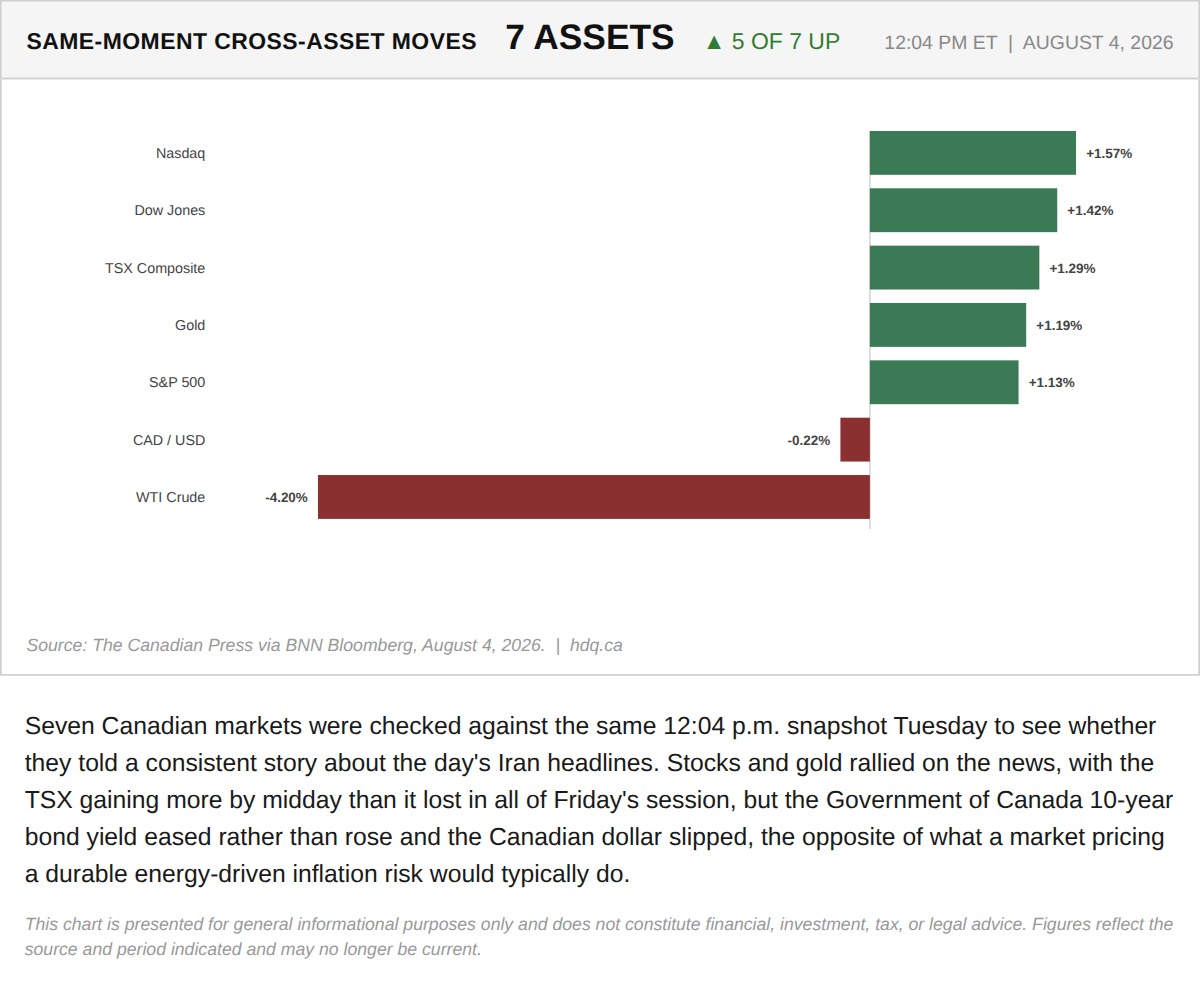
Seven Canadian markets were checked against the same 12:04 p.m.
Stocks and Gold Believed Tuesday's Iran Story. Bonds and the Loonie Did Not.
August 4, 2026
View chart & download
Brent was the only one of the three to finish above its starting level, while the index and gold both fell.
Brent, TSX and Gold Rebased to the August 31 Close
September 30, 2026
View chart & download
The Bank of Canada held its policy rate at 2.25% for a seventh straight time, yet Canadian yields rose as United States yields surged.
Government of Canada Benchmark Yields, September 2026
September 30, 2026
View chart & download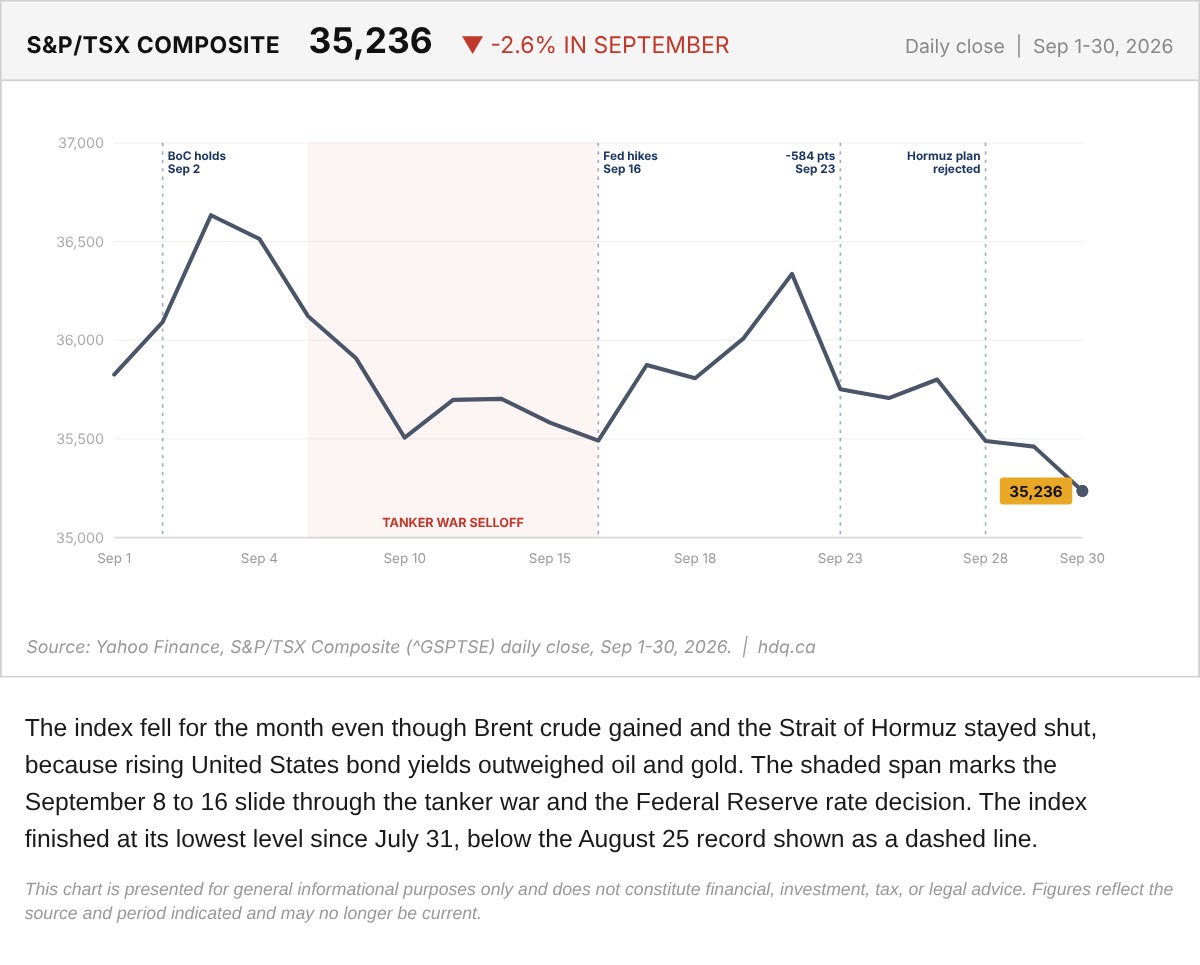
The index fell for the month even though Brent crude gained and the Strait of Hormuz stayed shut, because rising United States bond yields outweighed oil and gold.
S&P/TSX Composite Daily Close Through September 2026
September 30, 2026
View chart & download