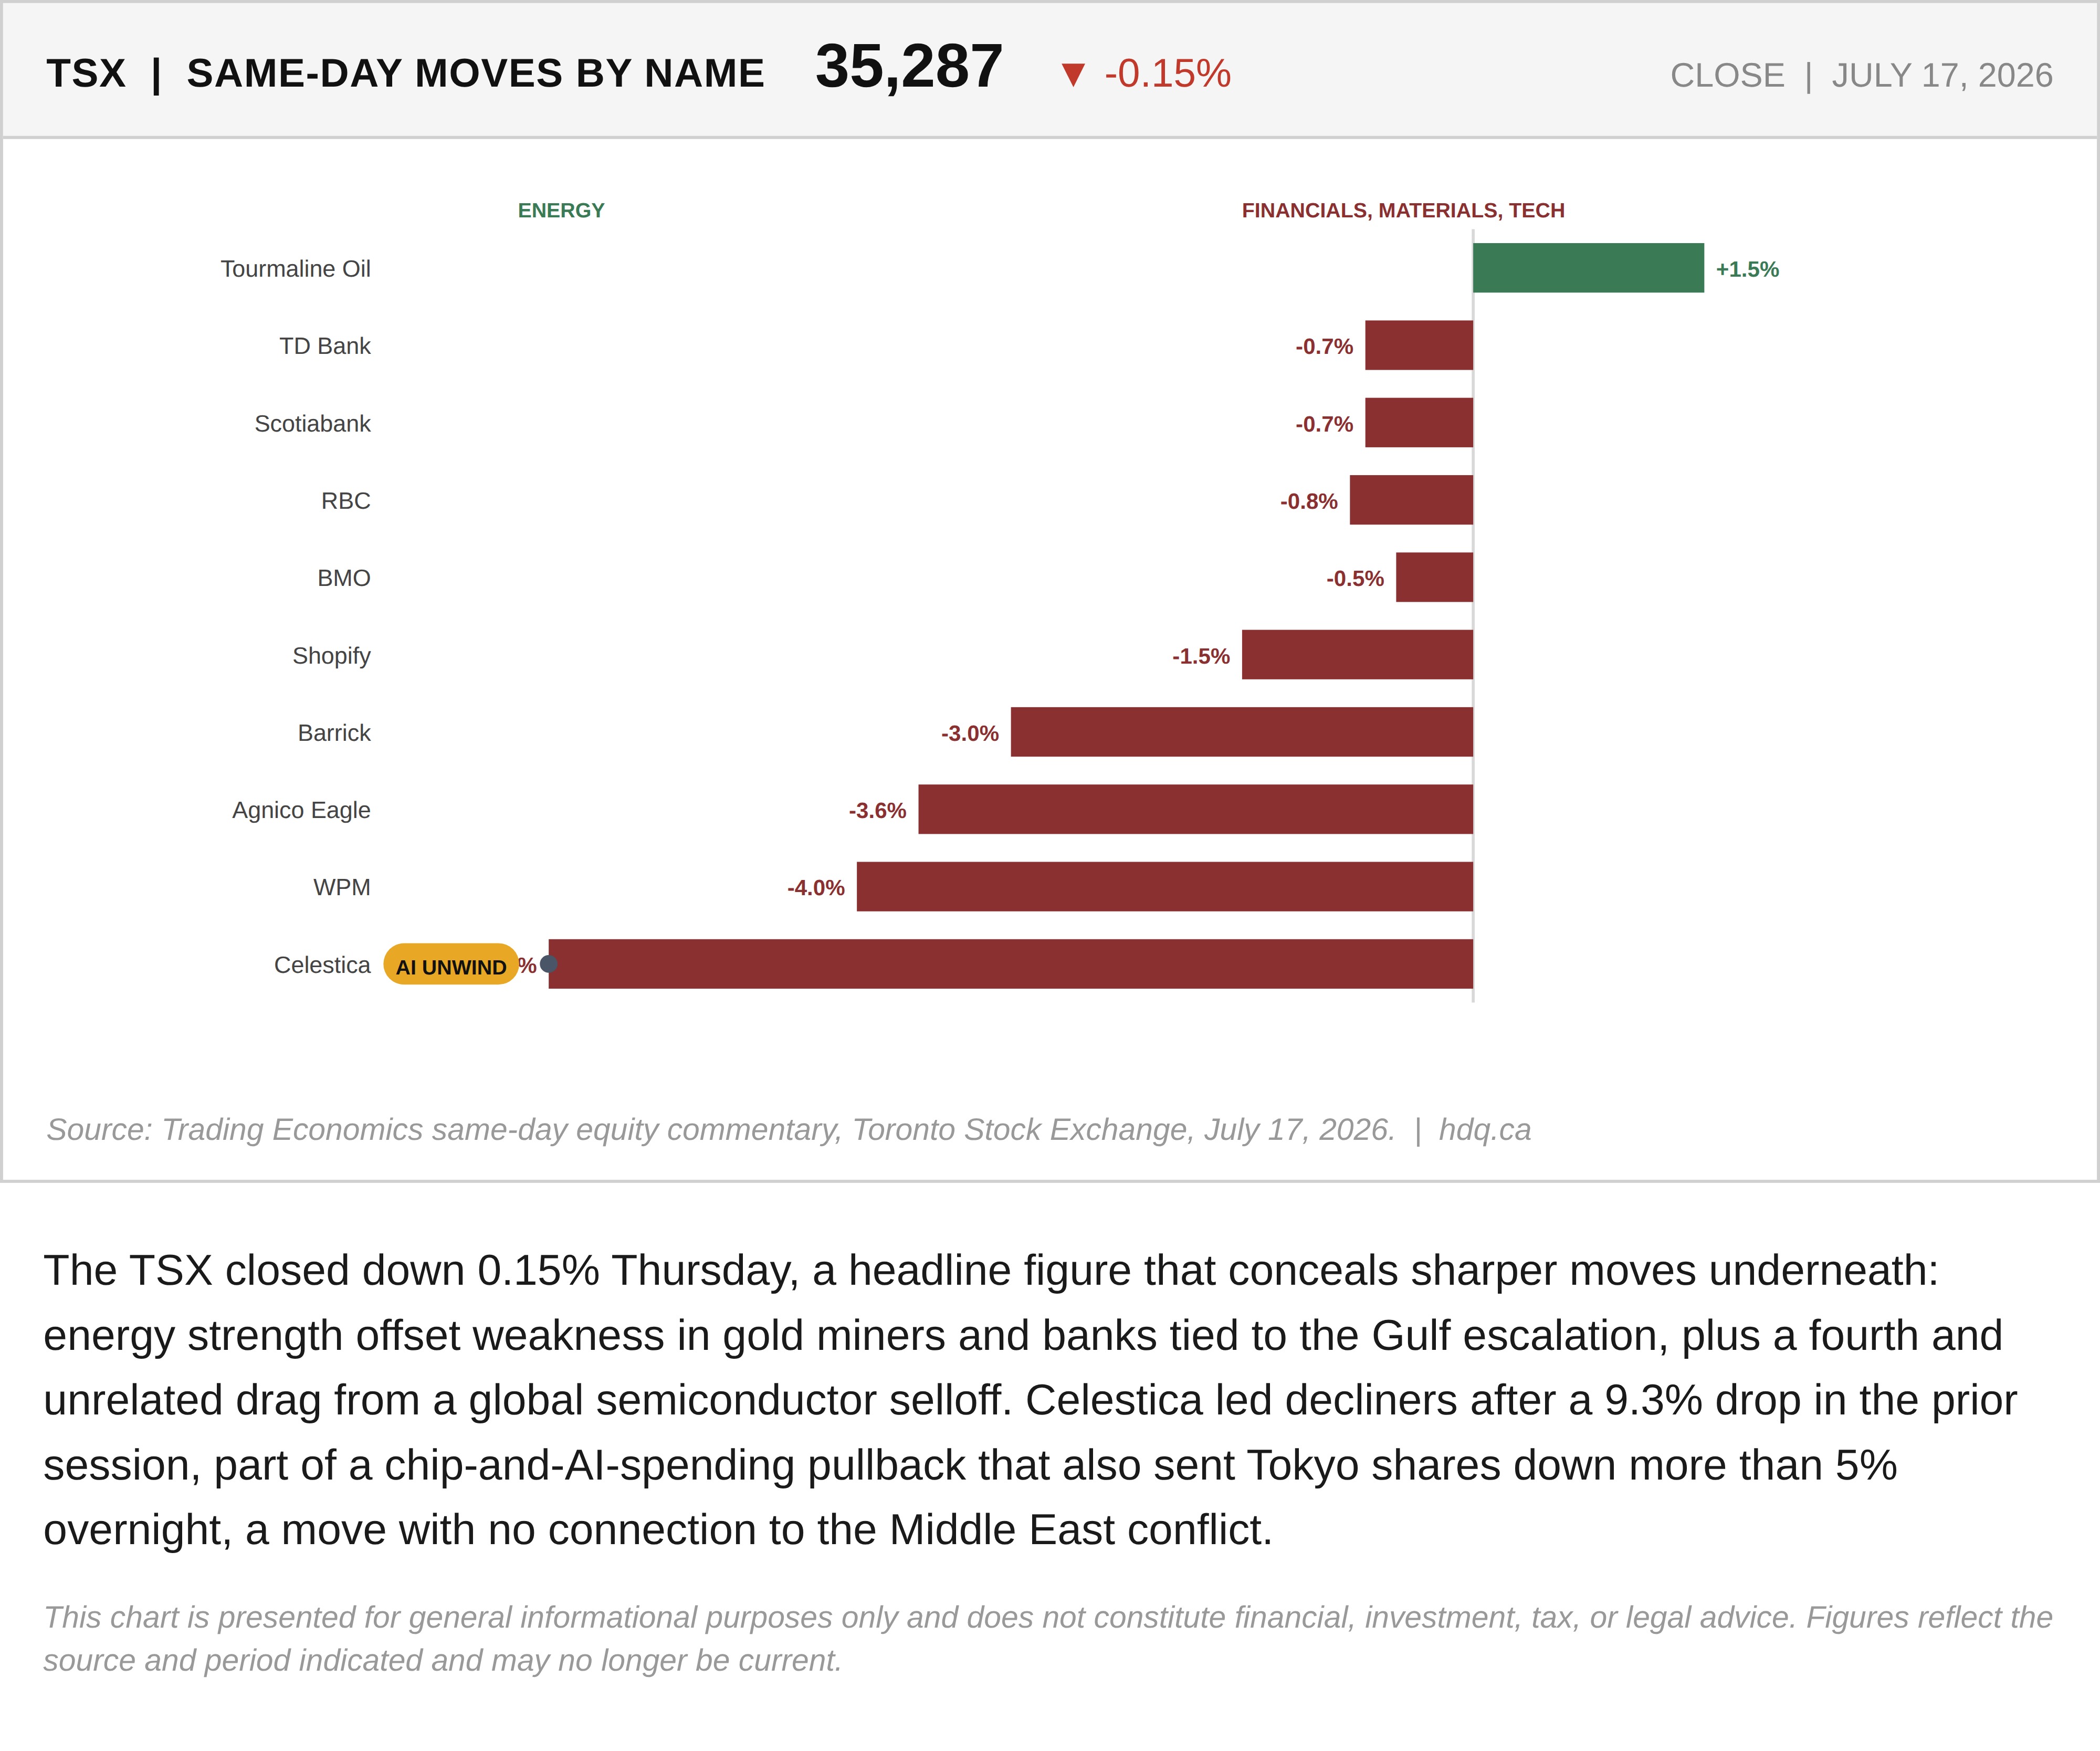
The TSX closed down 0.15% Thursday, a headline figure that conceals sharper moves underneath: energy strength offset weakness in gold miners and banks tied to the Gulf escalation, plus a fourth and unrelated drag from a global semiconductor selloff. Celestica led decliners after a 9.3% drop in the prior session, part of a chip-and-AI-spending pullback that also sent Tokyo shares down more than 5% overnight, a move with no connection to the Middle East conflict.
This chart is presented for general informational purposes only and does not constitute financial, investment, tax, or legal advice. Figures reflect the source and period indicated and may no longer be current.

Related charts

The S&P/TSX Composite closed July at 35,226, up 1.06% for the month, a modest headline figure that conceals sharp intra-month swings.
S&P/TSX Composite closes July up 1.06% after a volatile month
July 31, 2026
View chart & download
Brent and WTI crude both surged in July, with WTI ending the month at $85.47, up 23.0%, after round-tripping from a five-month low near $68.74.
WTI and Brent crude surge in July as the Iran ceasefire collapses
July 31, 2026
View chart & download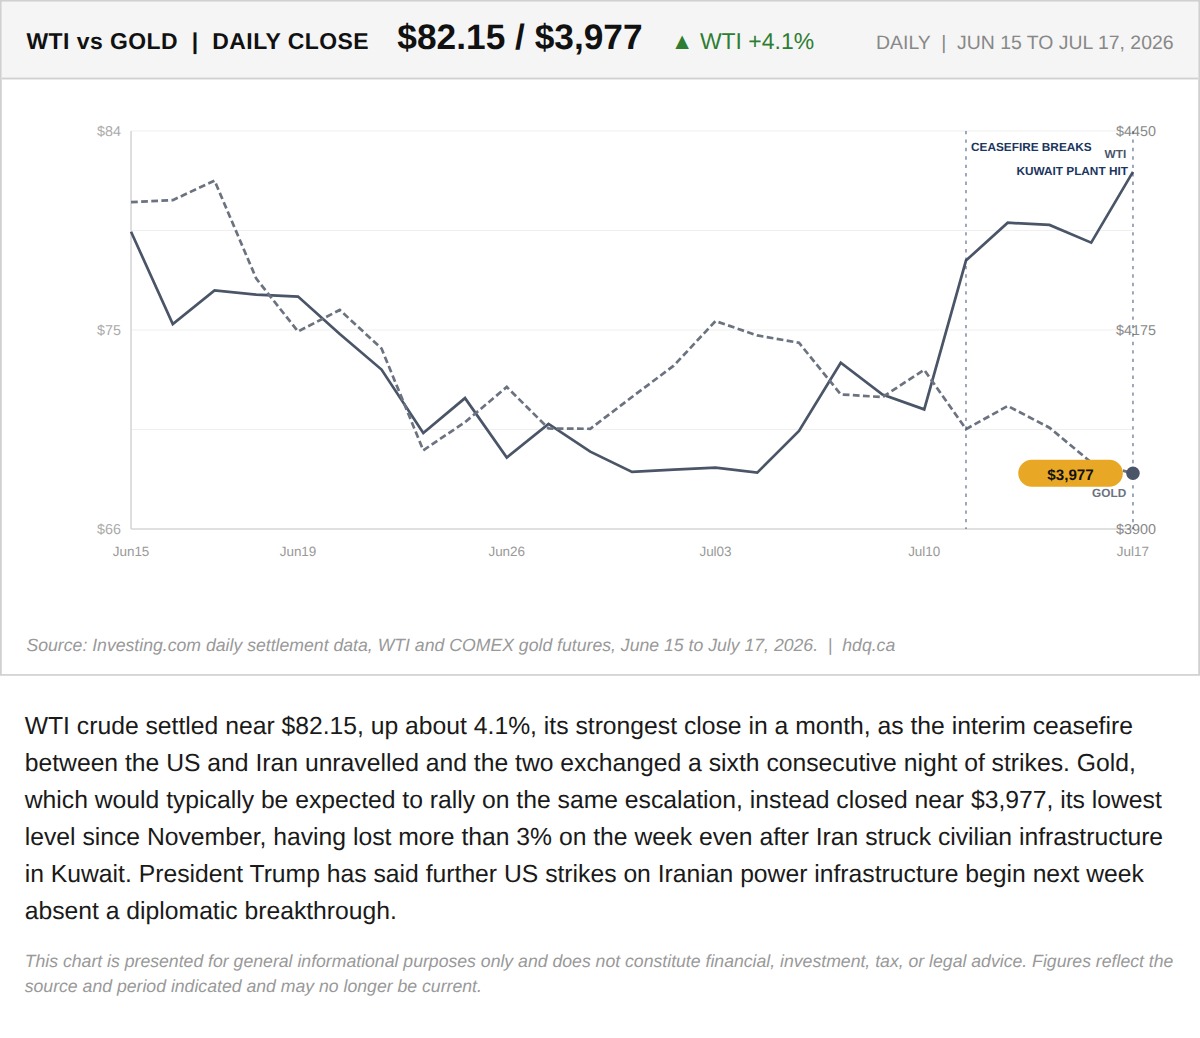
WTI crude settled near $82.15, up about 4.1%, its strongest close in a month, as the interim ceasefire between the US and Iran unravelled…
Gold's Refusal to Rally on a Collapsed Ceasefire Is the Market's Verdict on This War
July 17, 2026
View chart & download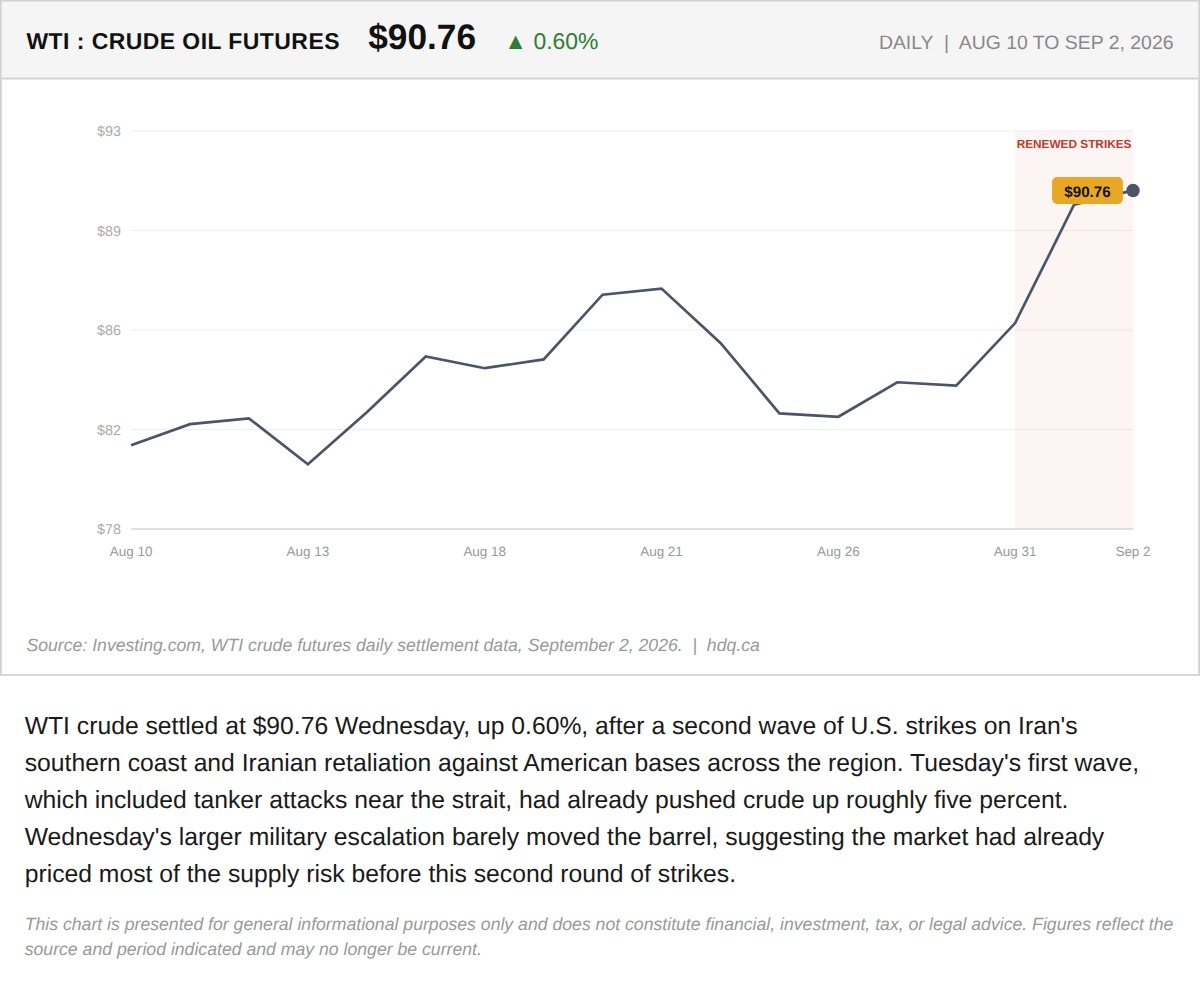
WTI crude settled at $90.76 Wednesday, up 0.60%, after a second wave of U.S.
WTI Crude Adds 0.60% as a Second Wave of Strikes Near Iran Barely Moves the Barrel
September 2, 2026
View chart & download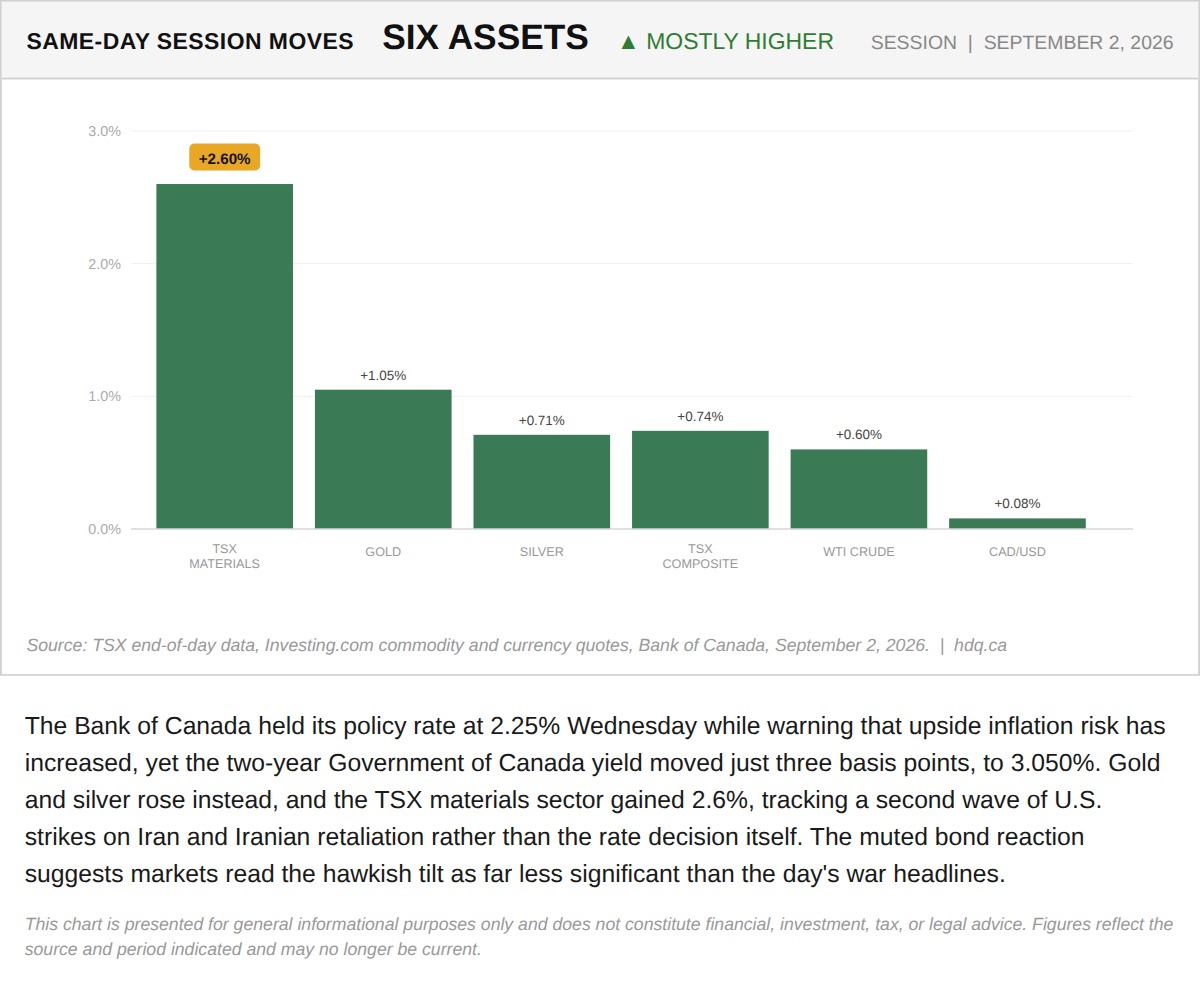
The Bank of Canada held its policy rate at 2.25% Wednesday while warning that upside inflation risk has increased, yet the two-year…
TSX Materials, Gold and Silver Lead a Broad Same-Day Rally Across Six Assets
September 2, 2026
View chart & download
Brent was the only one of the three to finish above its starting level, while the index and gold both fell.
Brent, TSX and Gold Rebased to the August 31 Close
September 30, 2026
View chart & download