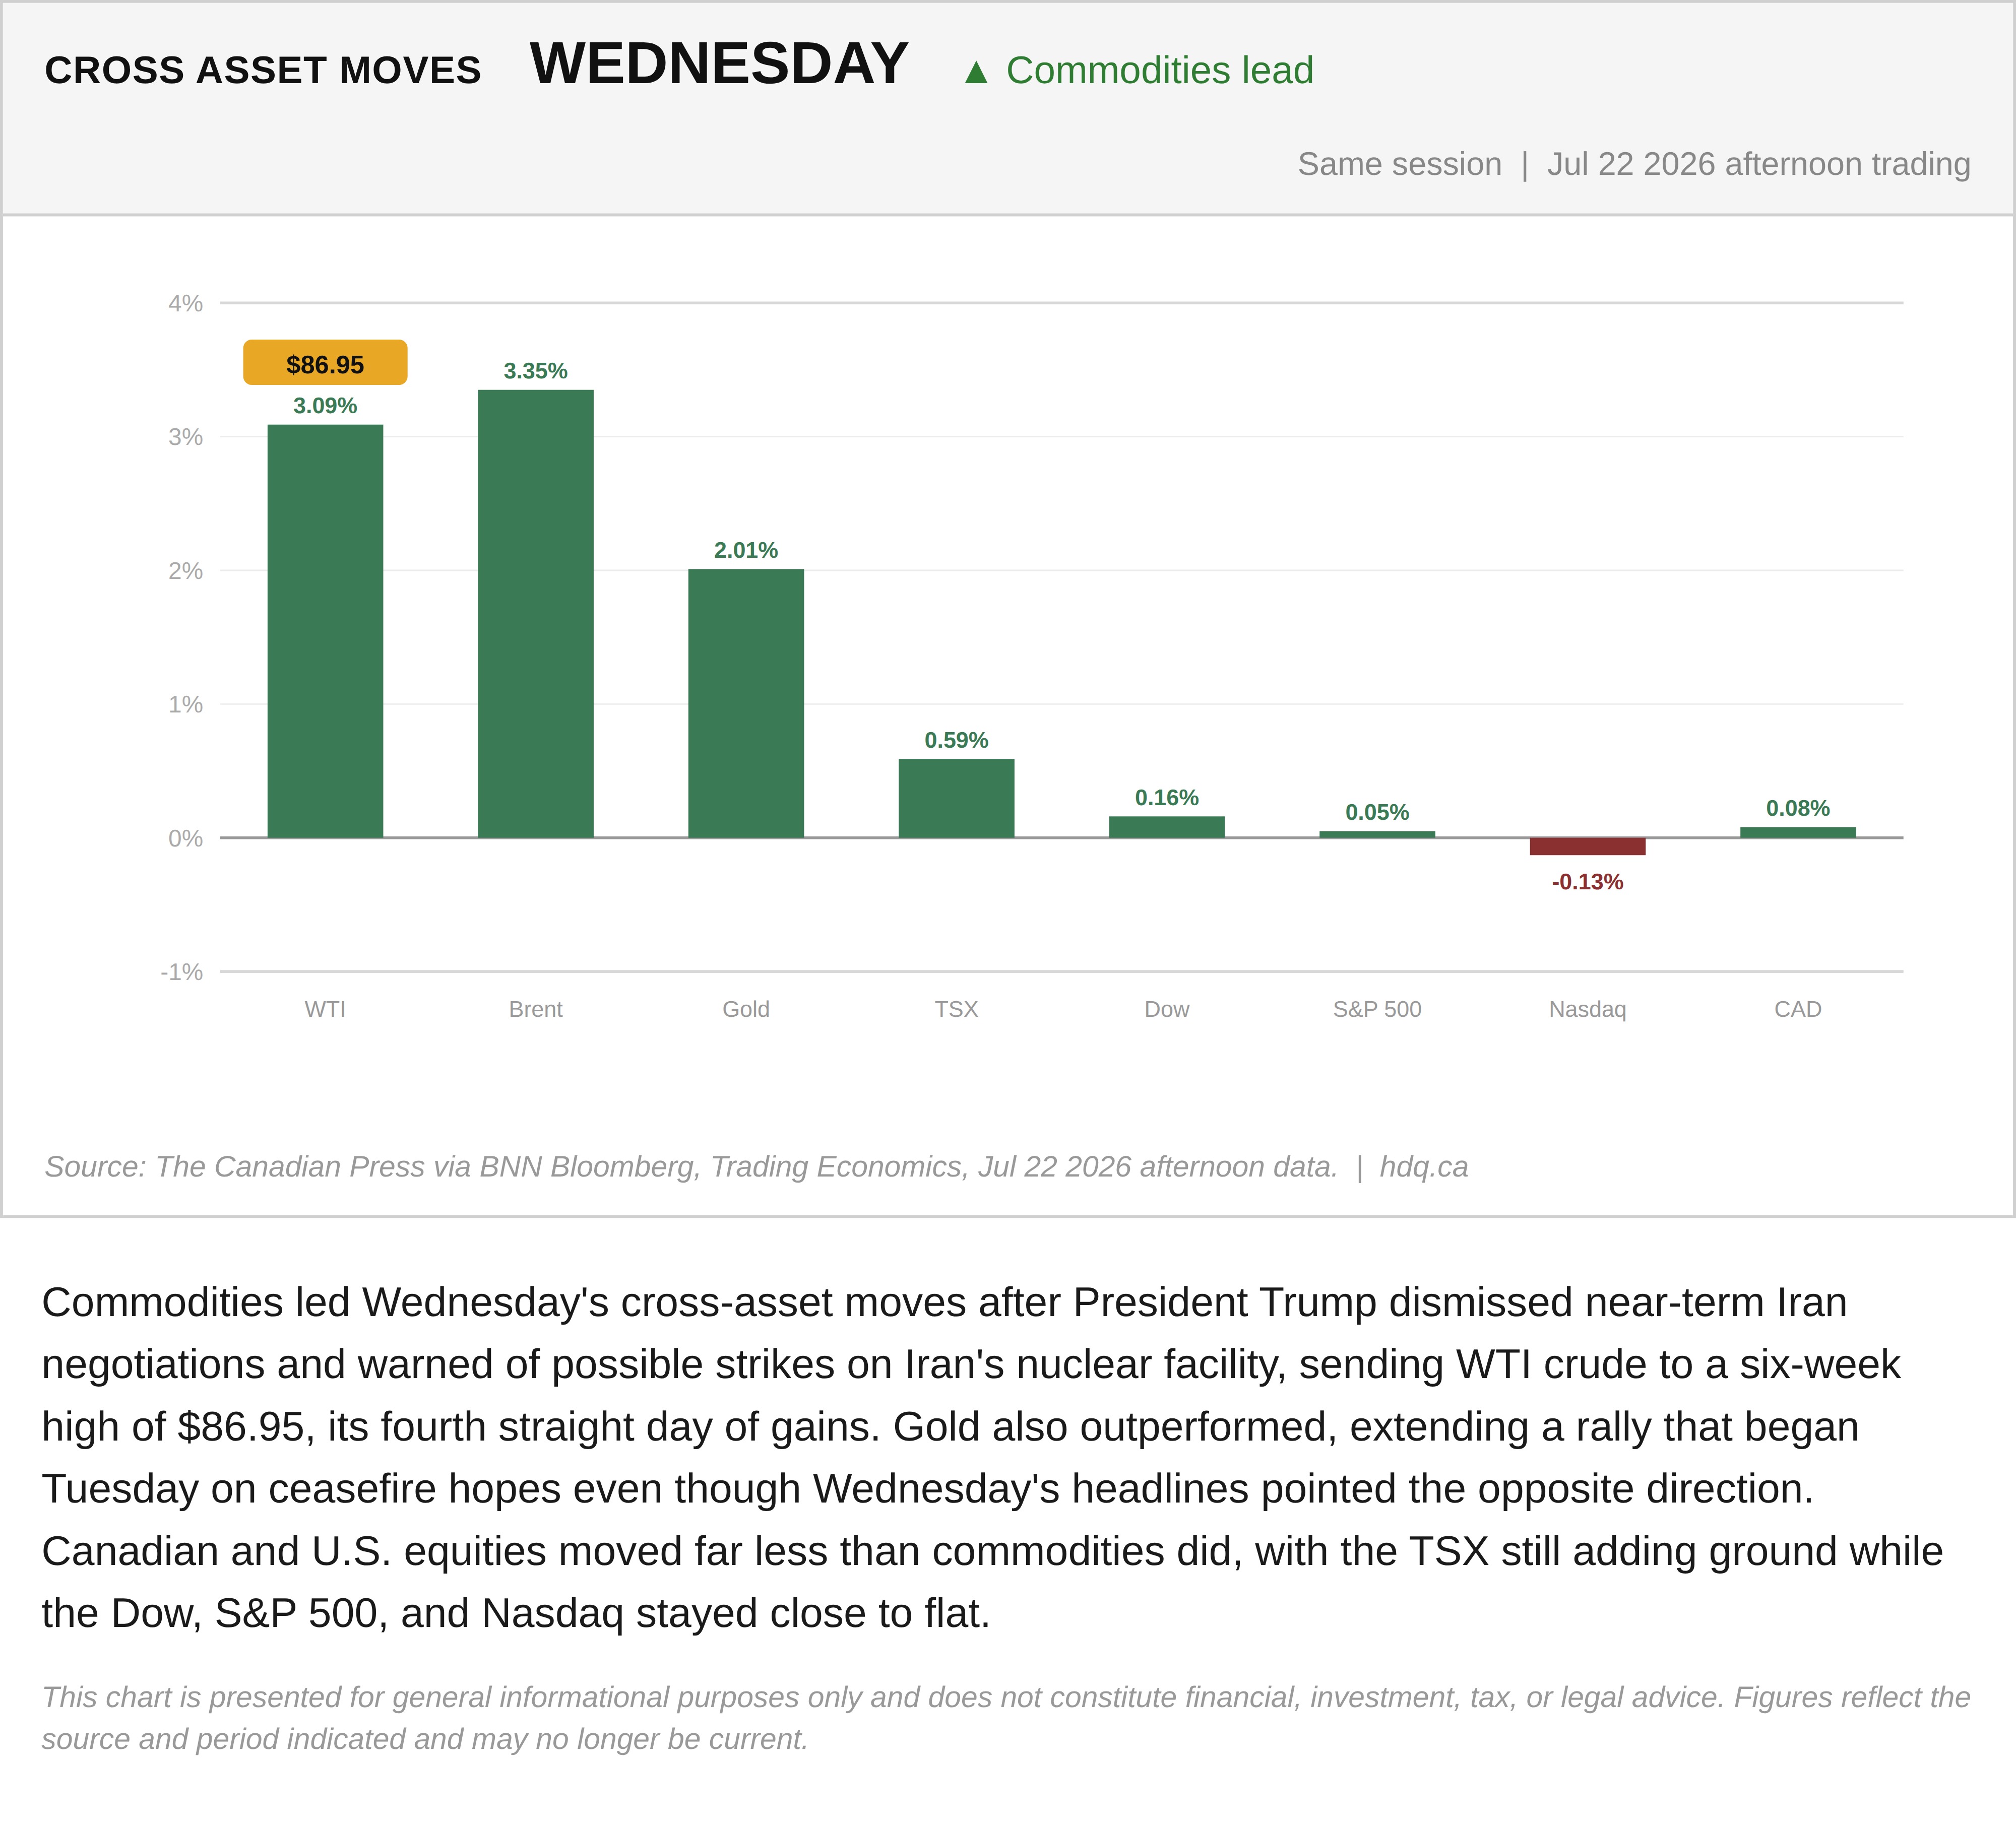
Commodities led Wednesday's cross-asset moves after President Trump dismissed near-term Iran negotiations and warned of possible strikes on Iran's nuclear facility, sending WTI crude to a six-week high of $86.95, its fourth straight day of gains. Gold also outperformed, extending a rally that began Tuesday on ceasefire hopes even though Wednesday's headlines pointed the opposite direction. Canadian and U.S. equities moved far less than commodities did, with the TSX still adding ground while the Dow, S&P 500, and Nasdaq stayed close to flat.
This chart is presented for general informational purposes only and does not constitute financial, investment, tax, or legal advice. Figures reflect the source and period indicated and may no longer be current.

Related charts

The S&P/TSX Composite closed July at 35,226, up 1.06% for the month, a modest headline figure that conceals sharp intra-month swings.
S&P/TSX Composite closes July up 1.06% after a volatile month
July 31, 2026
View chart & download
Brent and WTI crude both surged in July, with WTI ending the month at $85.47, up 23.0%, after round-tripping from a five-month low near $68.74.
WTI and Brent crude surge in July as the Iran ceasefire collapses
July 31, 2026
View chart & download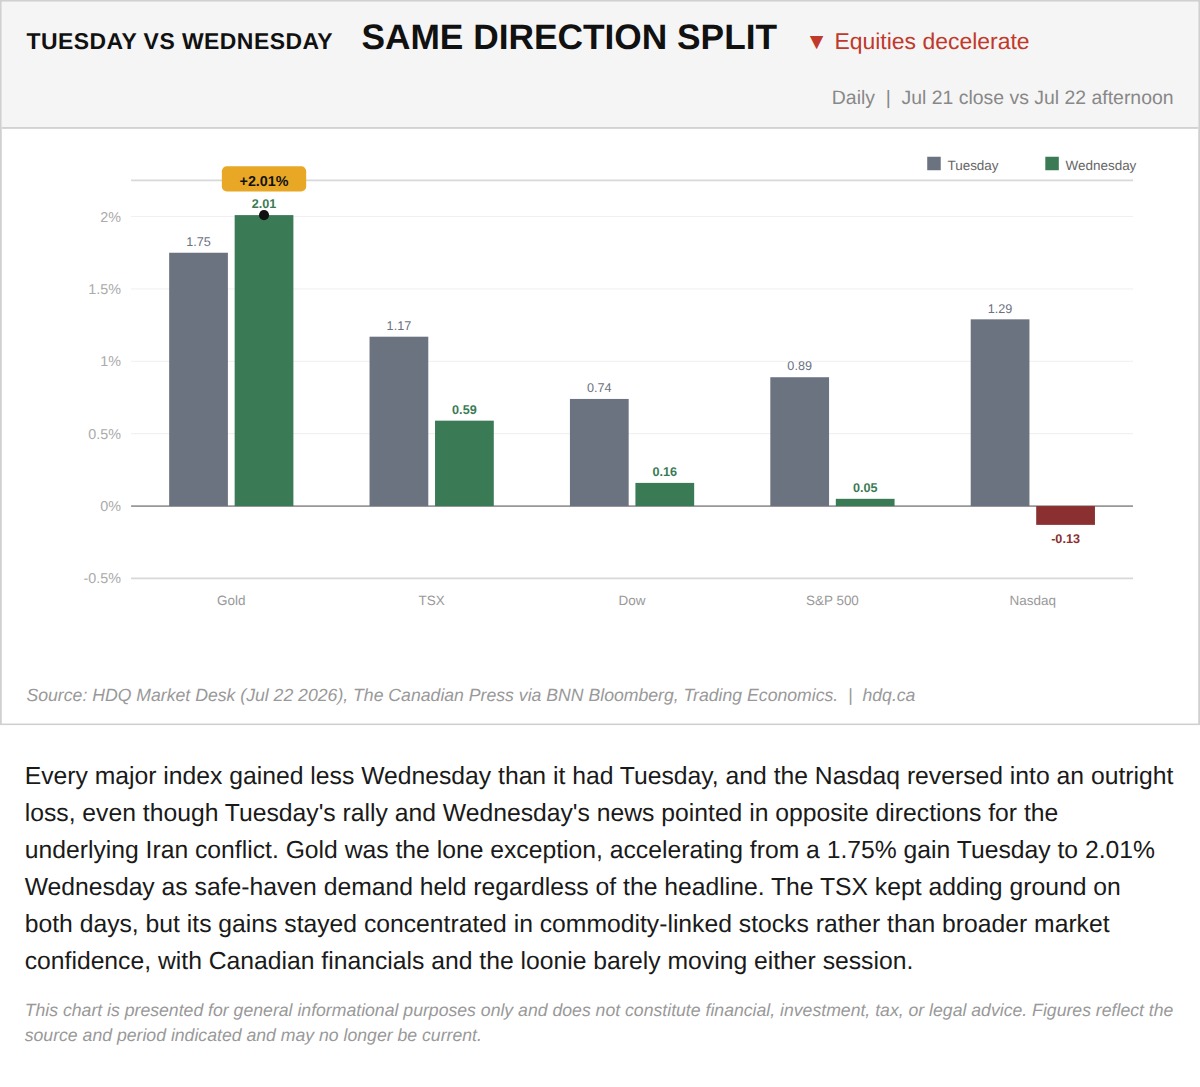
Every major index gained less Wednesday than it had Tuesday, and the Nasdaq reversed into an outright loss, even though Tuesday's rally and…
Every Major Index Cooled Wednesday Except Gold
July 22, 2026
View chart & download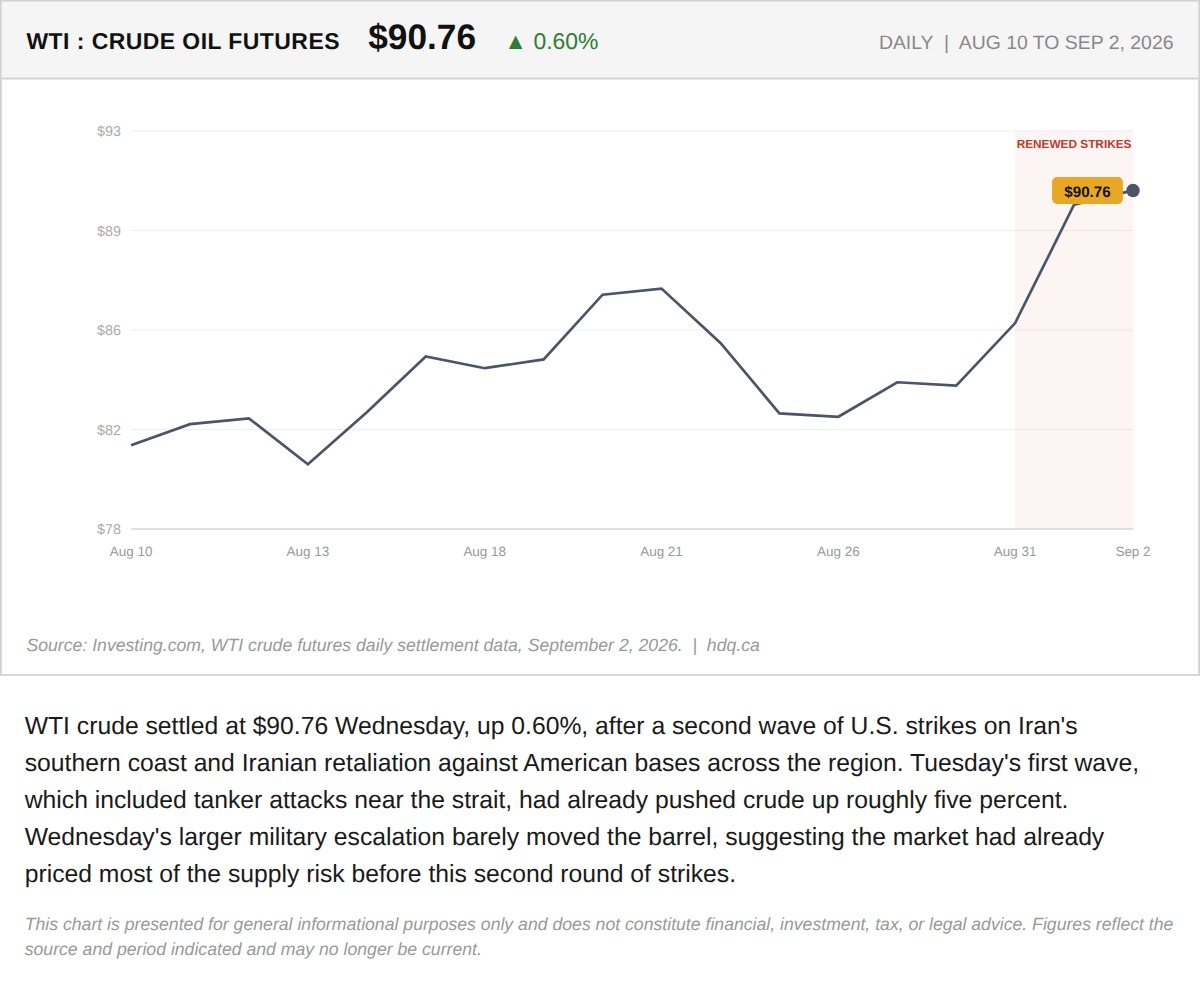
WTI crude settled at $90.76 Wednesday, up 0.60%, after a second wave of U.S.
WTI Crude Adds 0.60% as a Second Wave of Strikes Near Iran Barely Moves the Barrel
September 2, 2026
View chart & download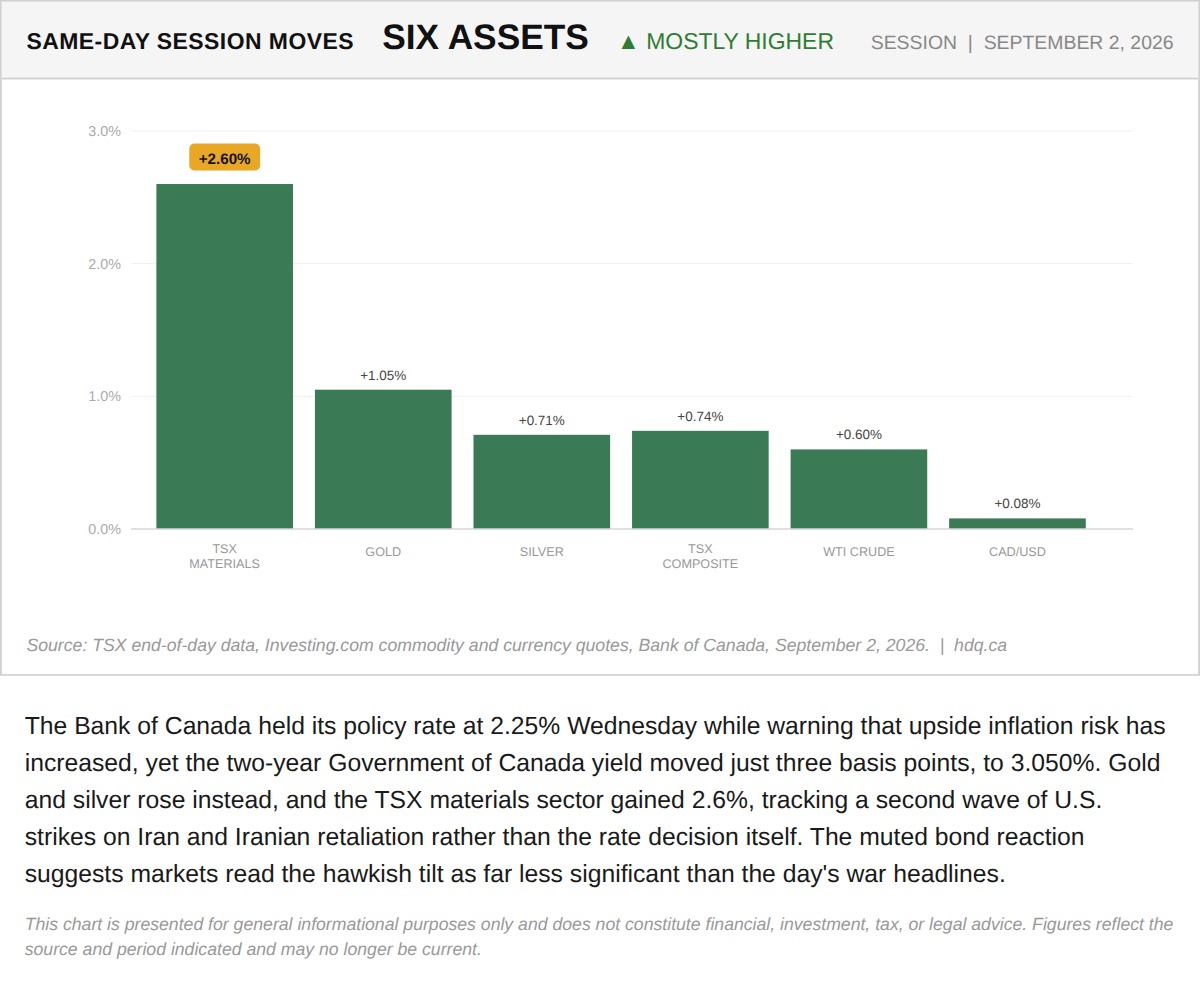
The Bank of Canada held its policy rate at 2.25% Wednesday while warning that upside inflation risk has increased, yet the two-year…
TSX Materials, Gold and Silver Lead a Broad Same-Day Rally Across Six Assets
September 2, 2026
View chart & download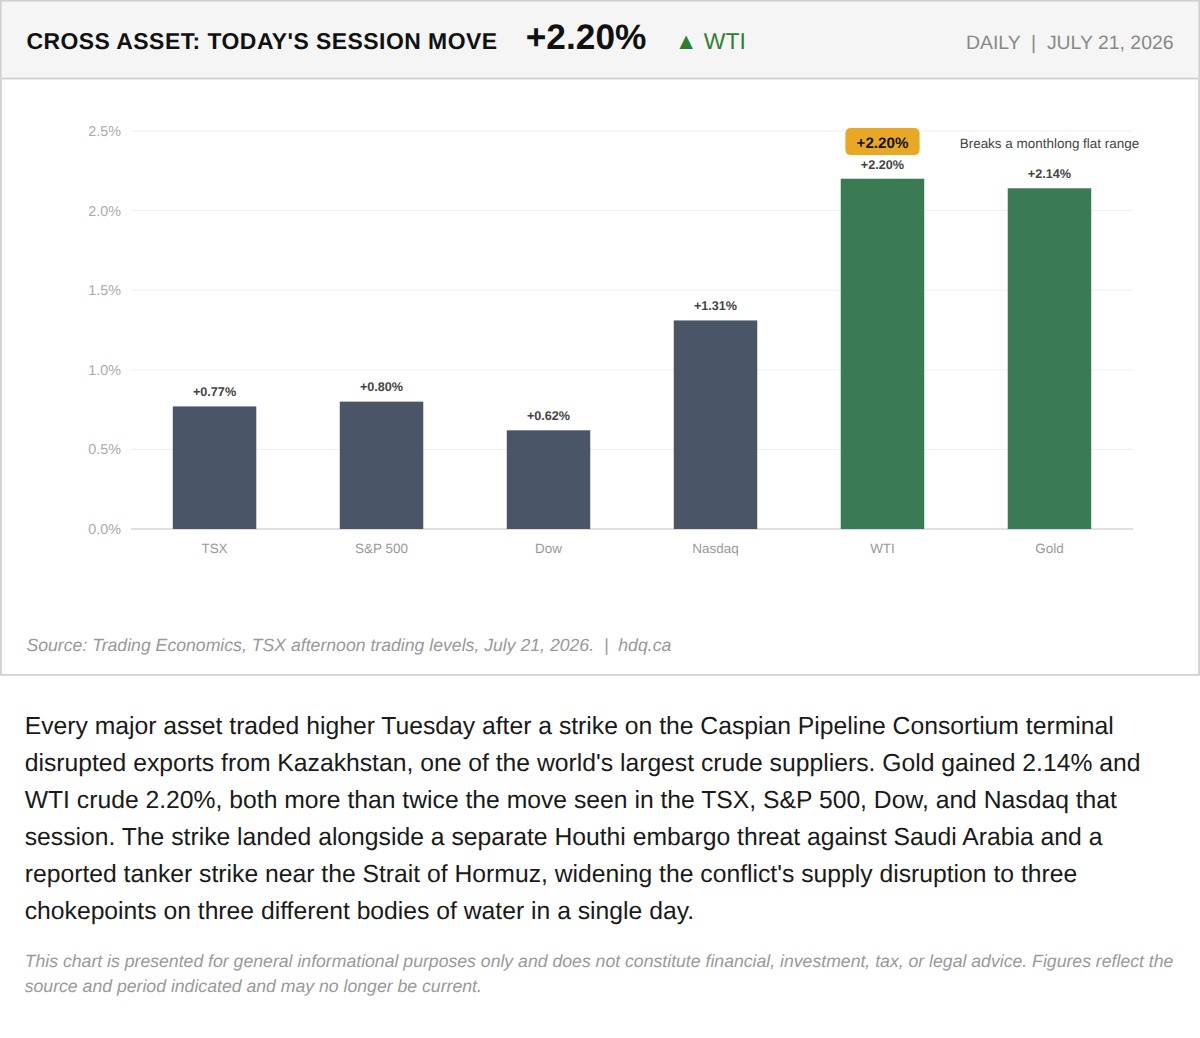
Every major asset traded higher Tuesday after a strike on the Caspian Pipeline Consortium terminal disrupted exports from Kazakhstan, one of the world's largest crude suppliers.
A Kazakhstan Pipeline Strike, Not Hormuz, Just Broke Gold's Monthlong Anchor
July 21, 2026
View chart & download