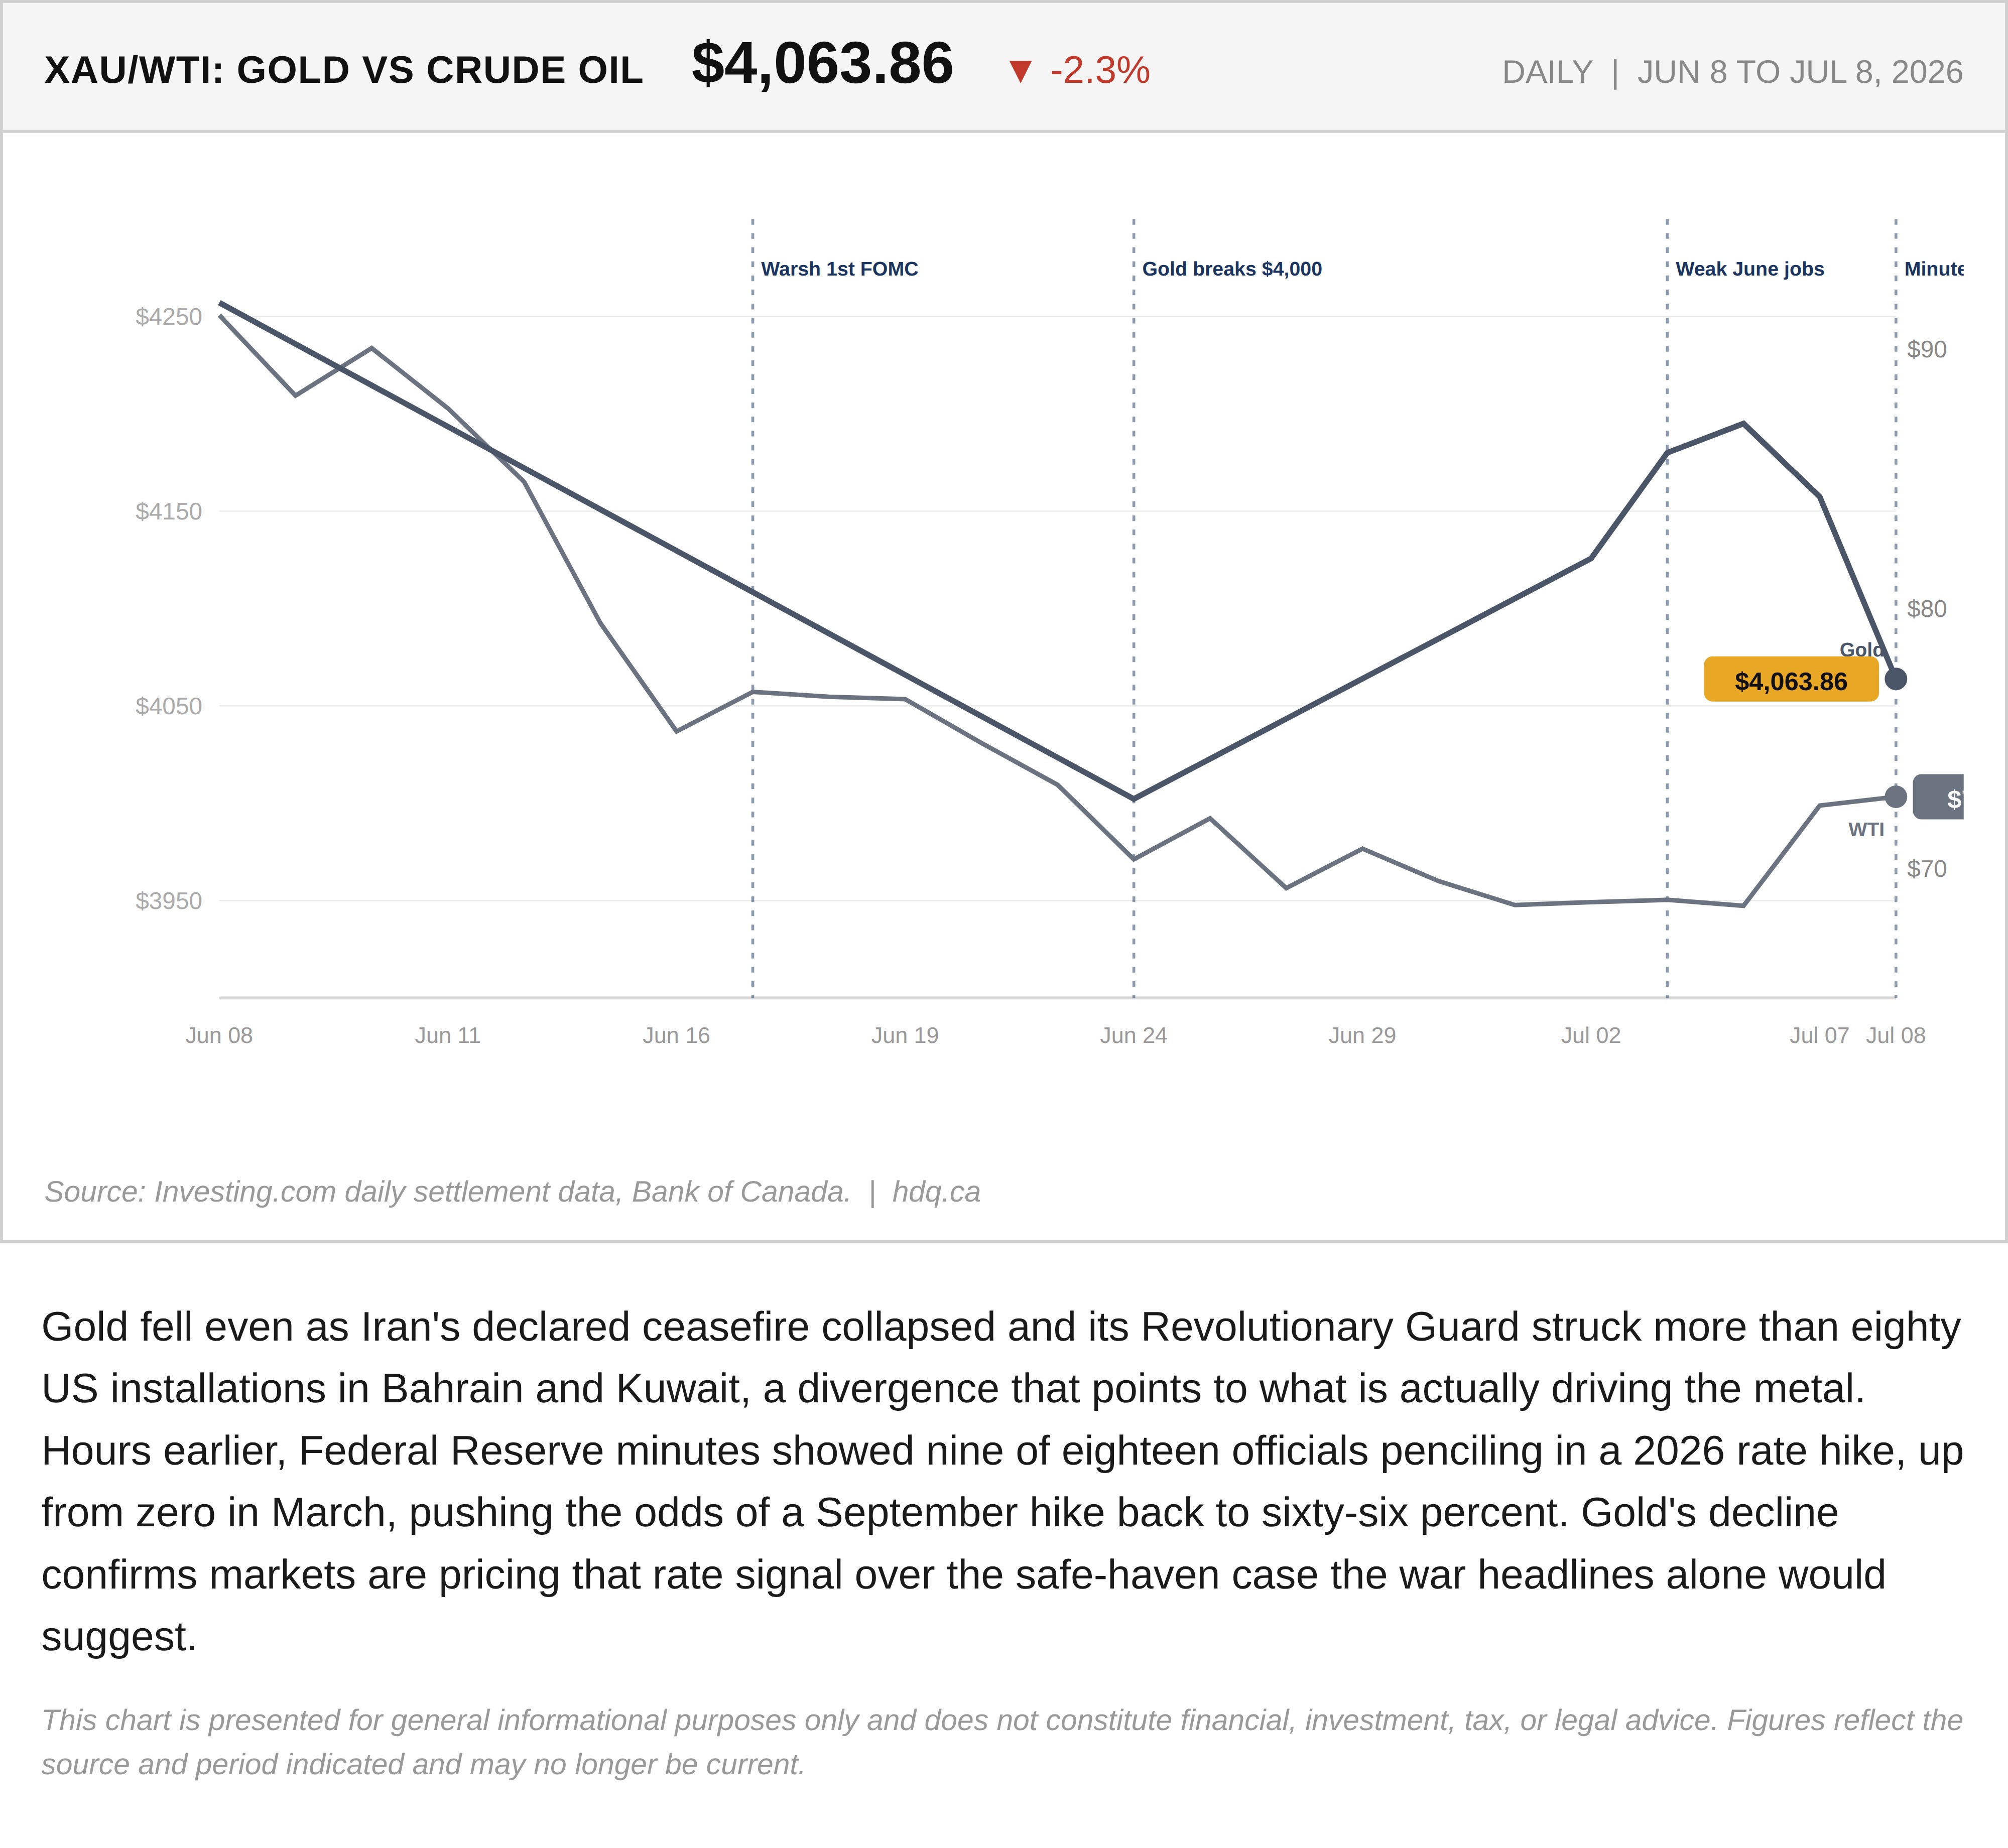
Gold fell even as Iran's declared ceasefire collapsed and its Revolutionary Guard struck more than eighty US installations in Bahrain and Kuwait, a divergence that points to what is actually driving the metal. Hours earlier, Federal Reserve minutes showed nine of eighteen officials penciling in a 2026 rate hike, up from zero in March, pushing the odds of a September hike back to sixty-six percent. Gold's decline confirms markets are pricing that rate signal over the safe-haven case the war headlines alone would suggest.
This chart is presented for general informational purposes only and does not constitute financial, investment, tax, or legal advice. Figures reflect the source and period indicated and may no longer be current.

Related charts
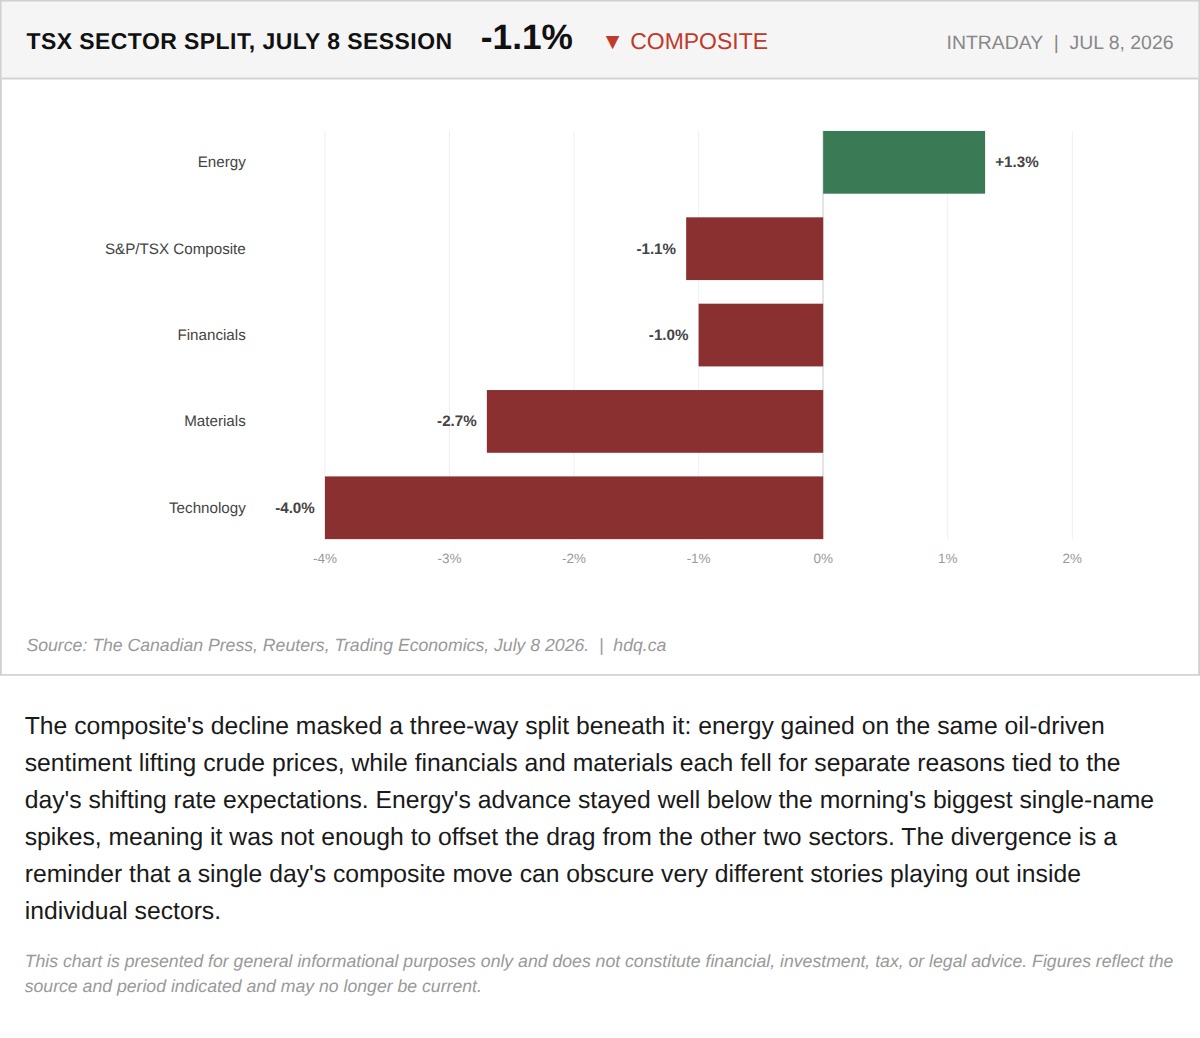
The composite's decline masked a three-way split beneath it: energy gained on the same oil-driven sentiment lifting crude prices, while…
The Fed's Minutes and the Iran Escalation Landed on the Same Afternoon, and Gold Picked a Side
July 8, 2026
View chart & download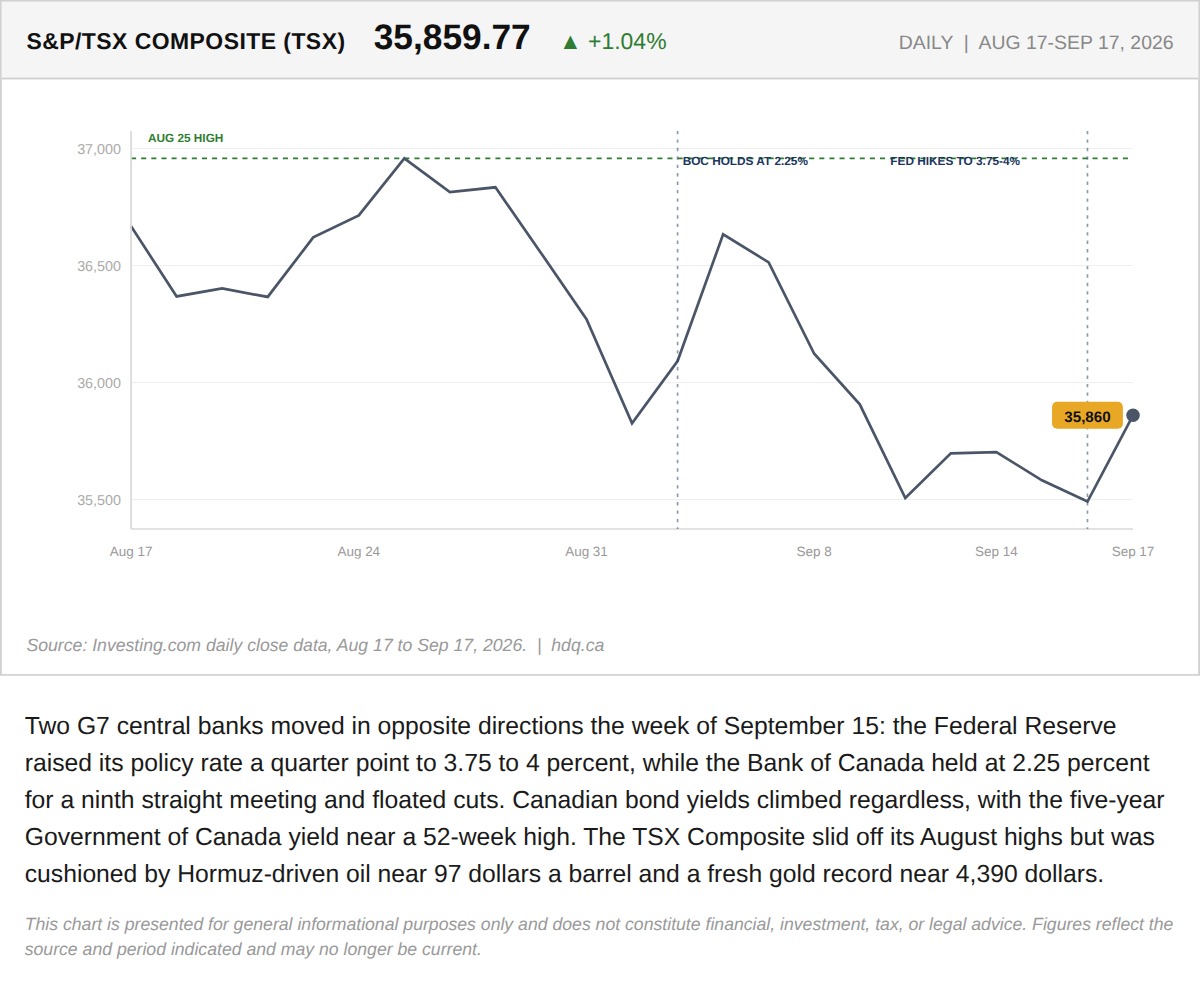
Two G7 central banks moved in opposite directions the week of September 15: the Federal Reserve raised its policy rate a quarter point to…
The Week the Bank of Canada's Own Rate Stopped Setting Canadian Borrowing Costs
September 19, 2026
View chart & download
The S&P/TSX Composite closed July at 35,226, up 1.06% for the month, a modest headline figure that conceals sharp intra-month swings.
S&P/TSX Composite closes July up 1.06% after a volatile month
July 31, 2026
View chart & download
Brent and WTI crude both surged in July, with WTI ending the month at $85.47, up 23.0%, after round-tripping from a five-month low near $68.74.
WTI and Brent crude surge in July as the Iran ceasefire collapses
July 31, 2026
View chart & download
Brent was the only one of the three to finish above its starting level, while the index and gold both fell.
Brent, TSX and Gold Rebased to the August 31 Close
September 30, 2026
View chart & download
The Bank of Canada held its policy rate at 2.25% for a seventh straight time, yet Canadian yields rose as United States yields surged.
Government of Canada Benchmark Yields, September 2026
September 30, 2026
View chart & download