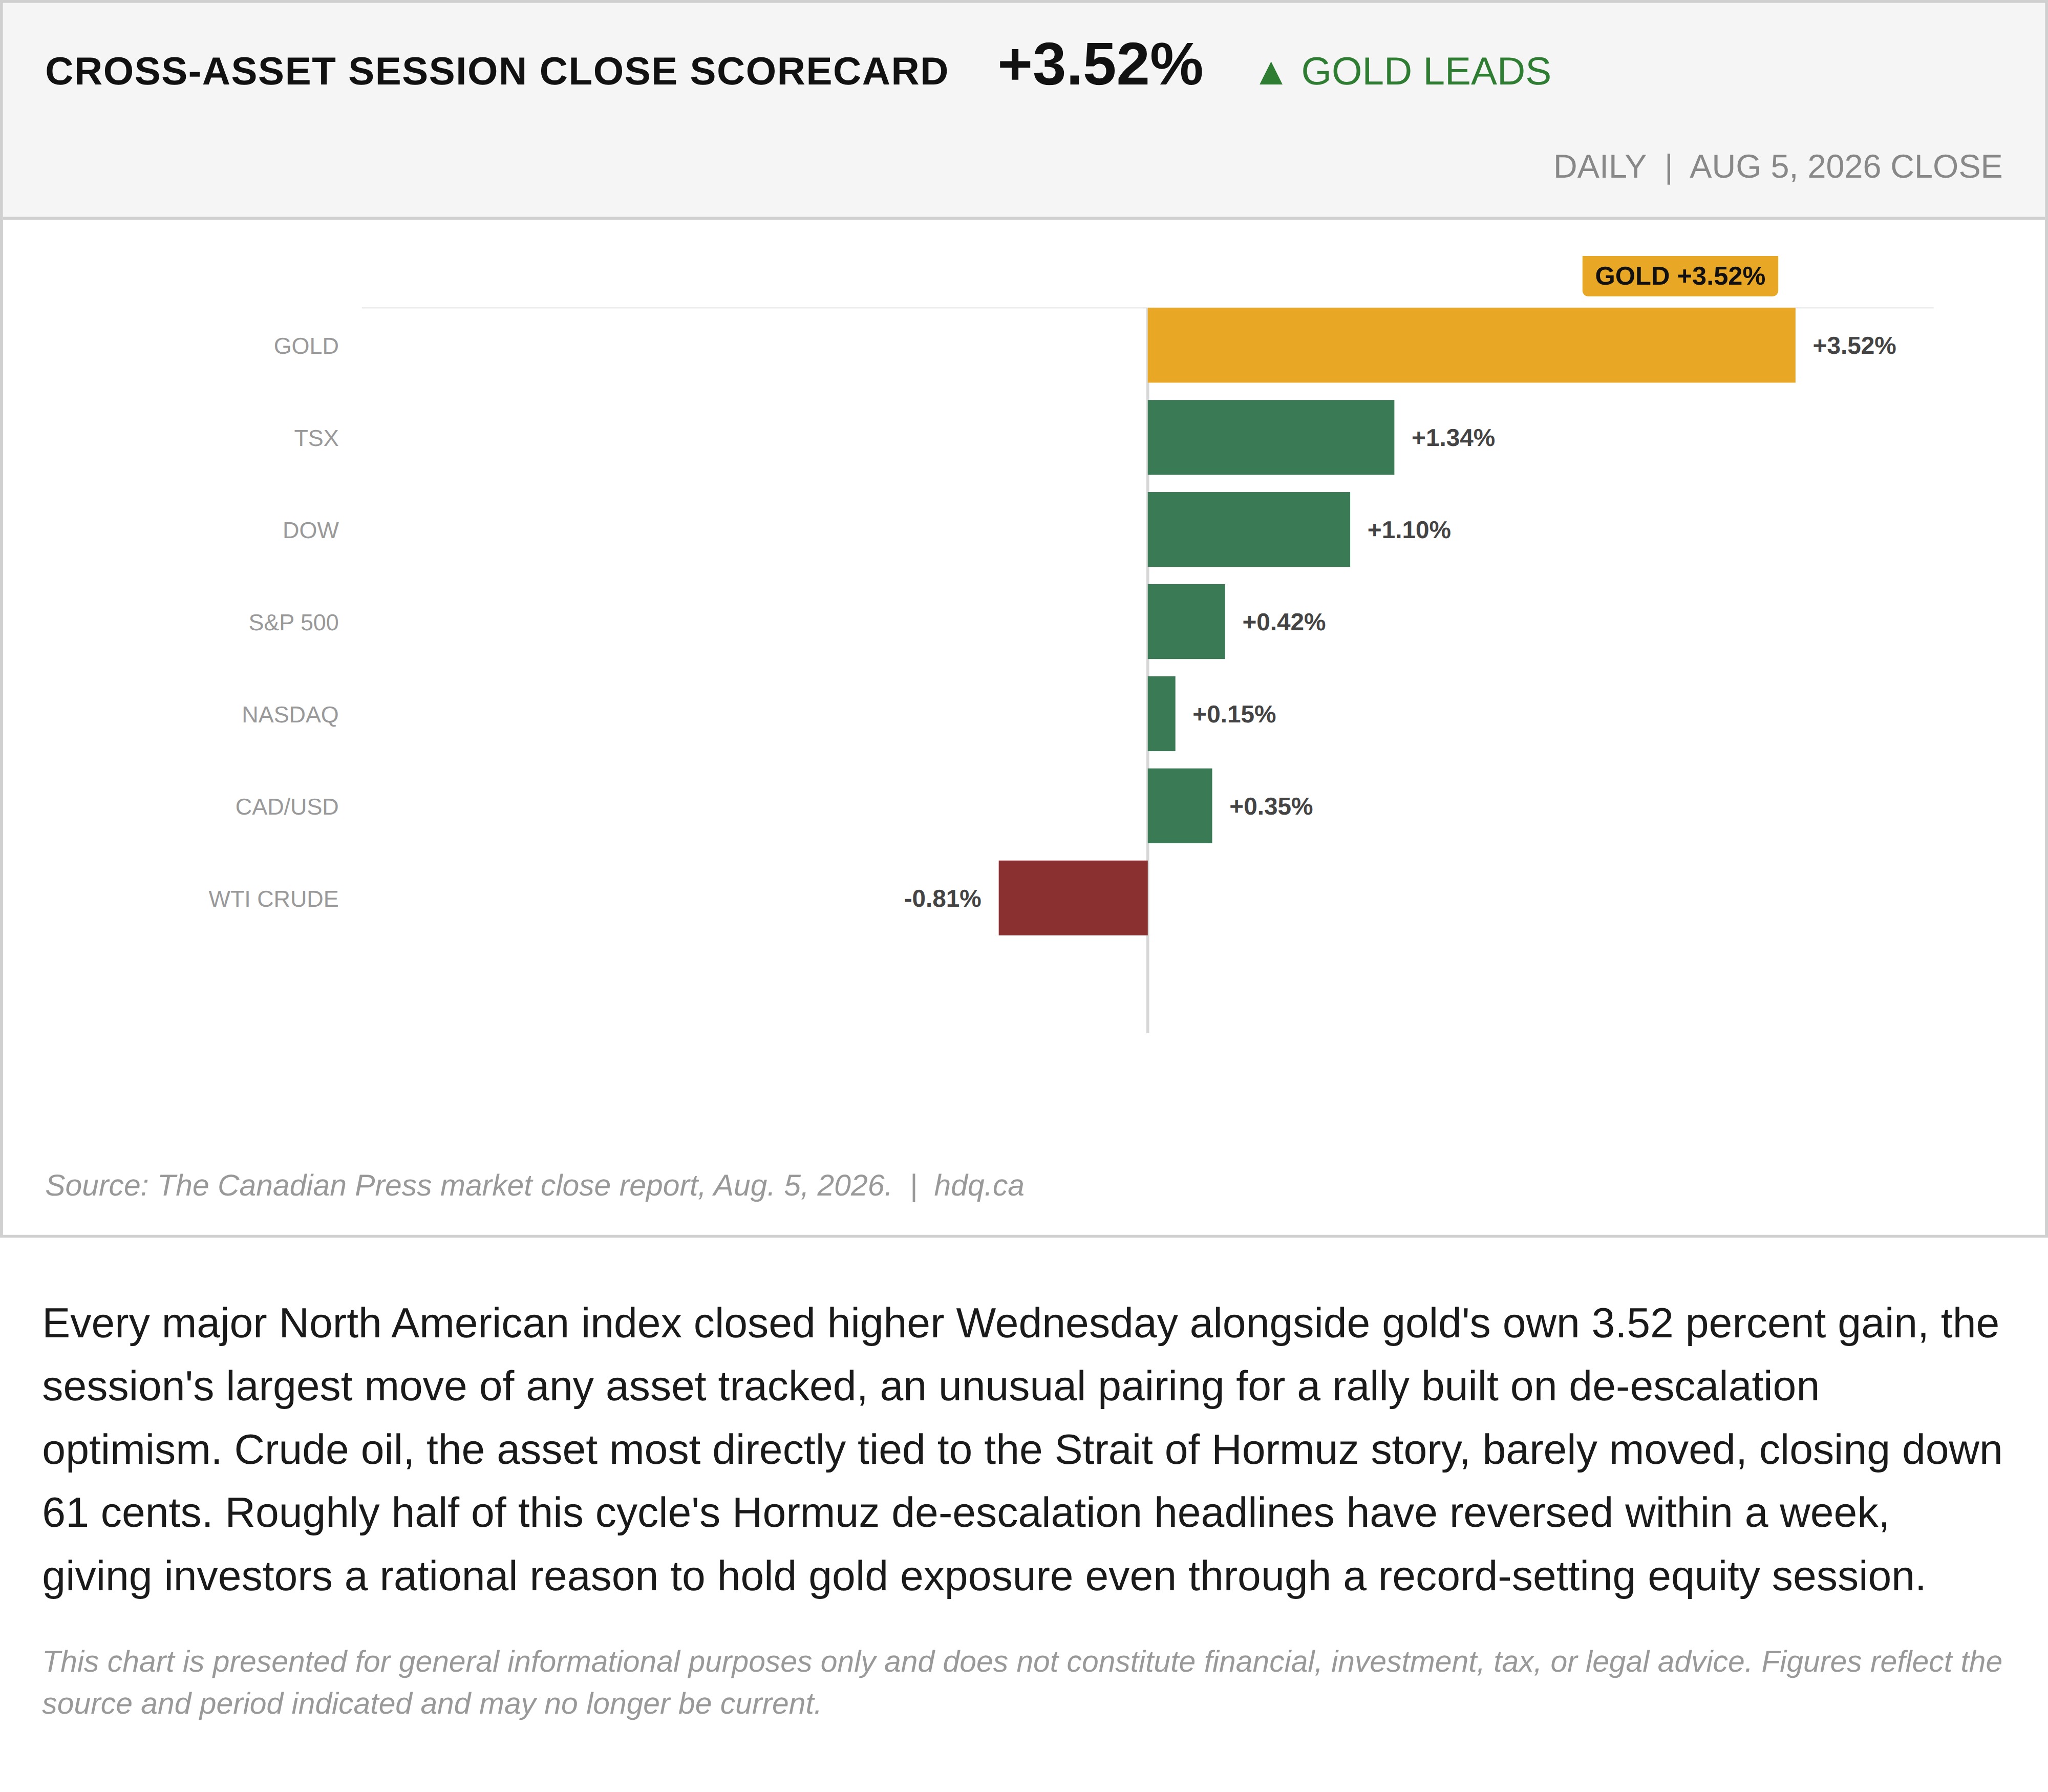
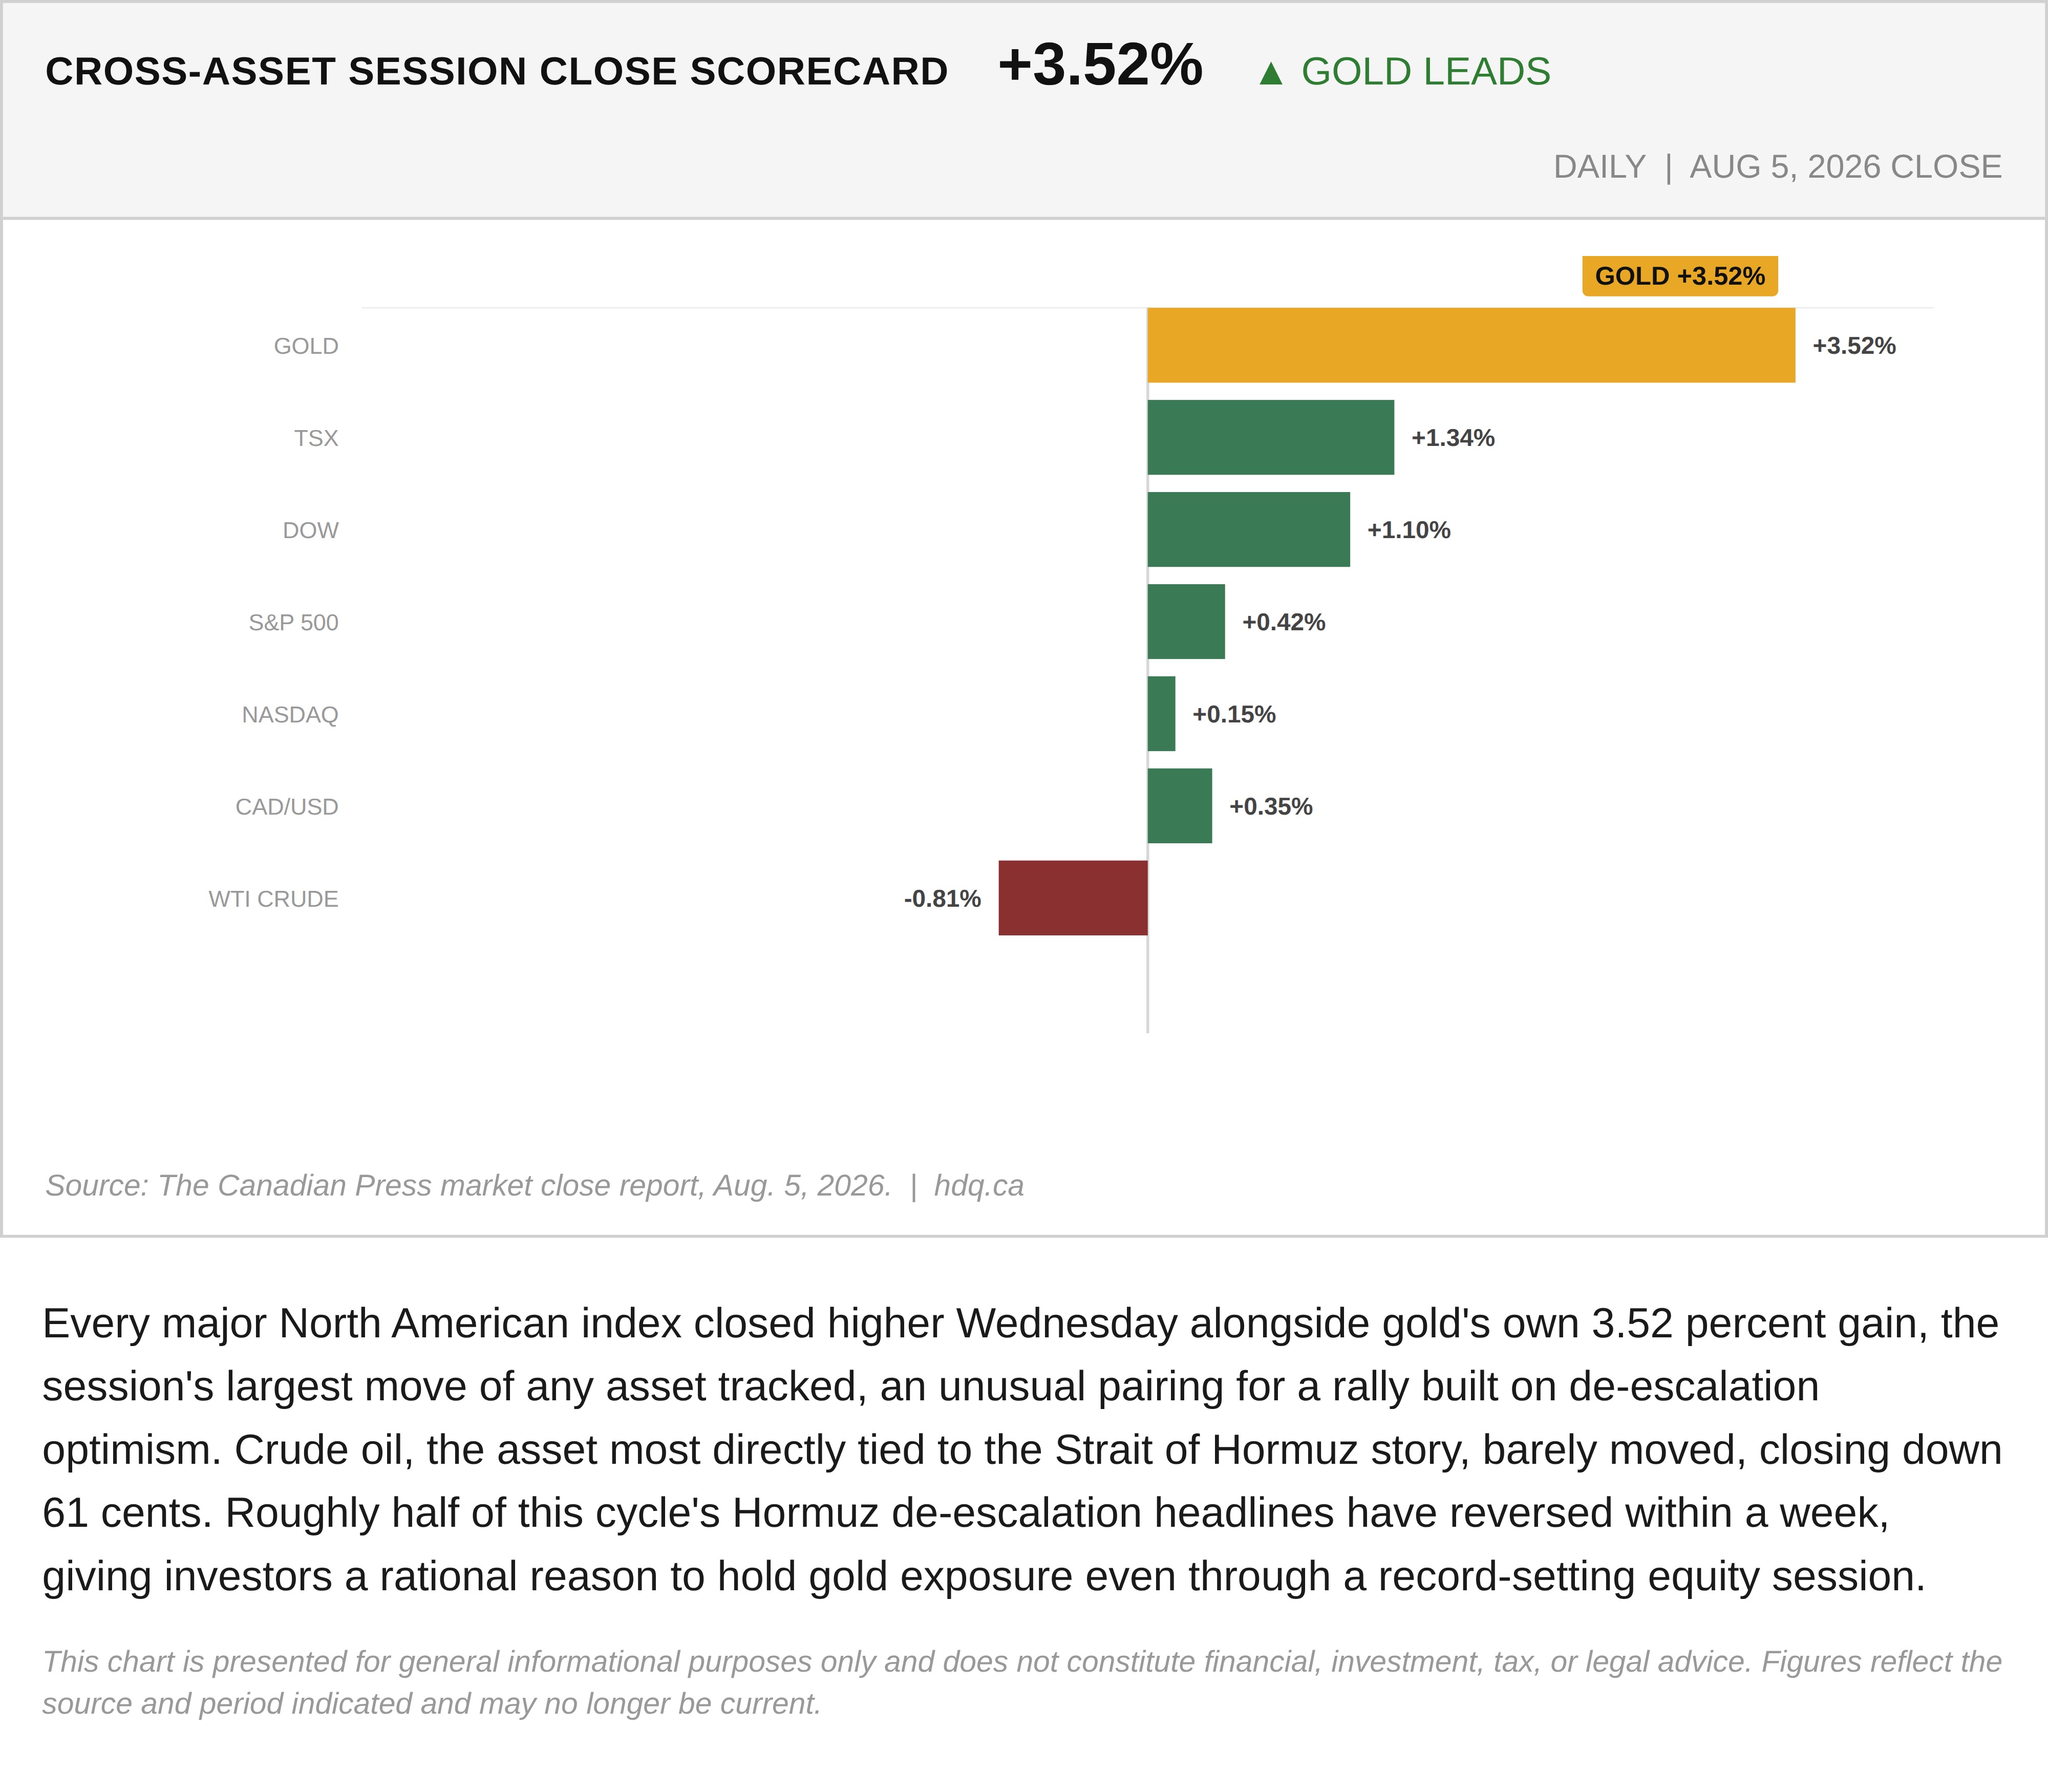
Every major North American index closed higher Wednesday alongside gold's own 3.52 percent gain, the session's largest move of any asset tracked, an unusual pairing for a rally built on de-escalation optimism. Crude oil, the asset most directly tied to the Strait of Hormuz story, barely moved, closing down 61 cents. Roughly half of this cycle's Hormuz de-escalation headlines have reversed within a week, giving investors a rational reason to hold gold exposure even through a record-setting equity session.
This chart is presented for general informational purposes only and does not constitute financial, investment, tax, or legal advice. Figures reflect the source and period indicated and may no longer be current.
Related charts
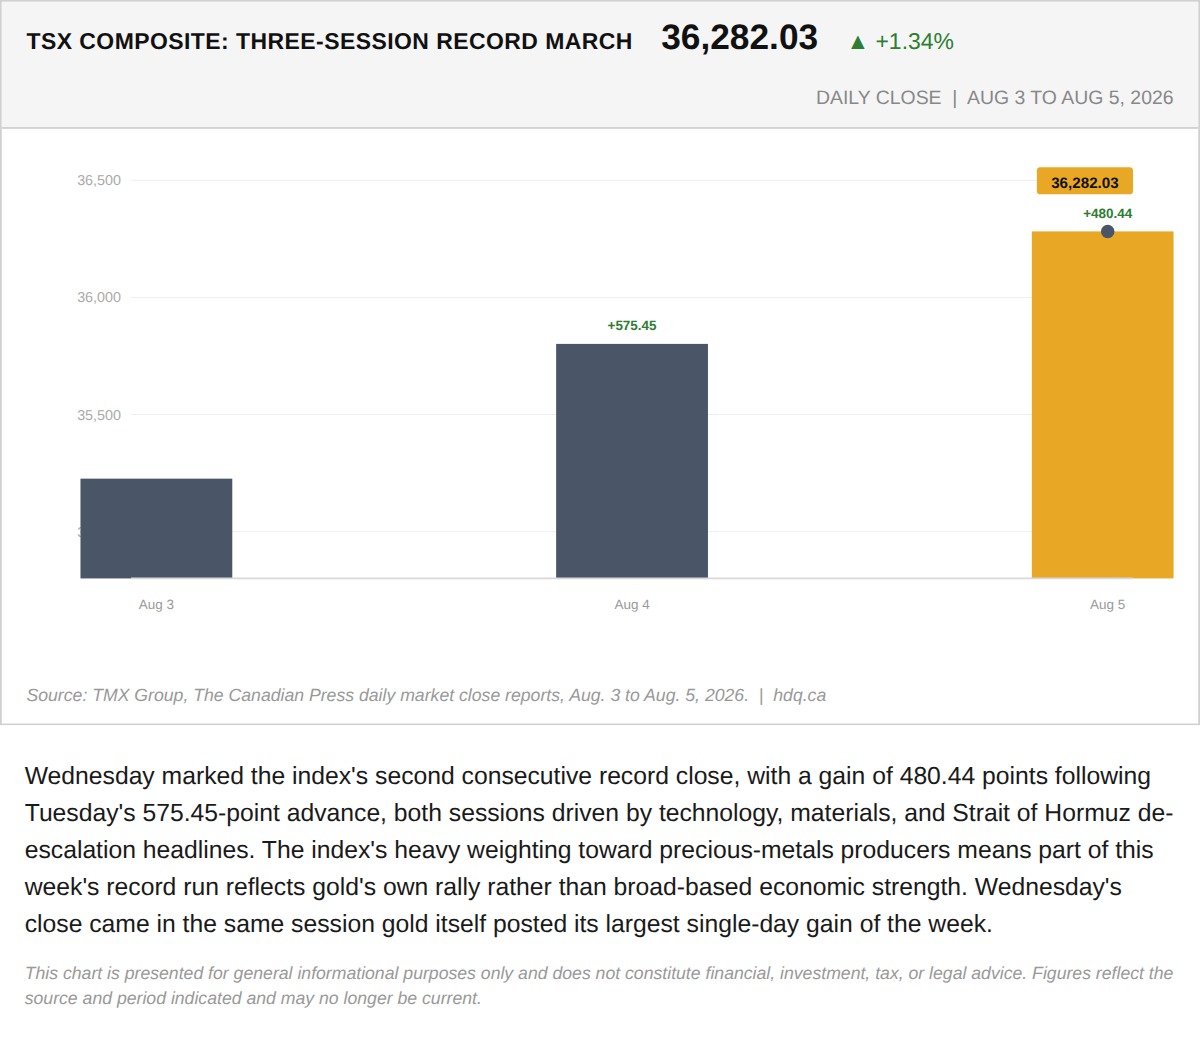
Wednesday marked the index's second consecutive record close, with a gain of 480.44 points following Tuesday's 575.45-point advance, both…
TSX Closes at a Record for the Second Straight Session, Up 480 Points Wednesday
August 5, 2026
View chart & download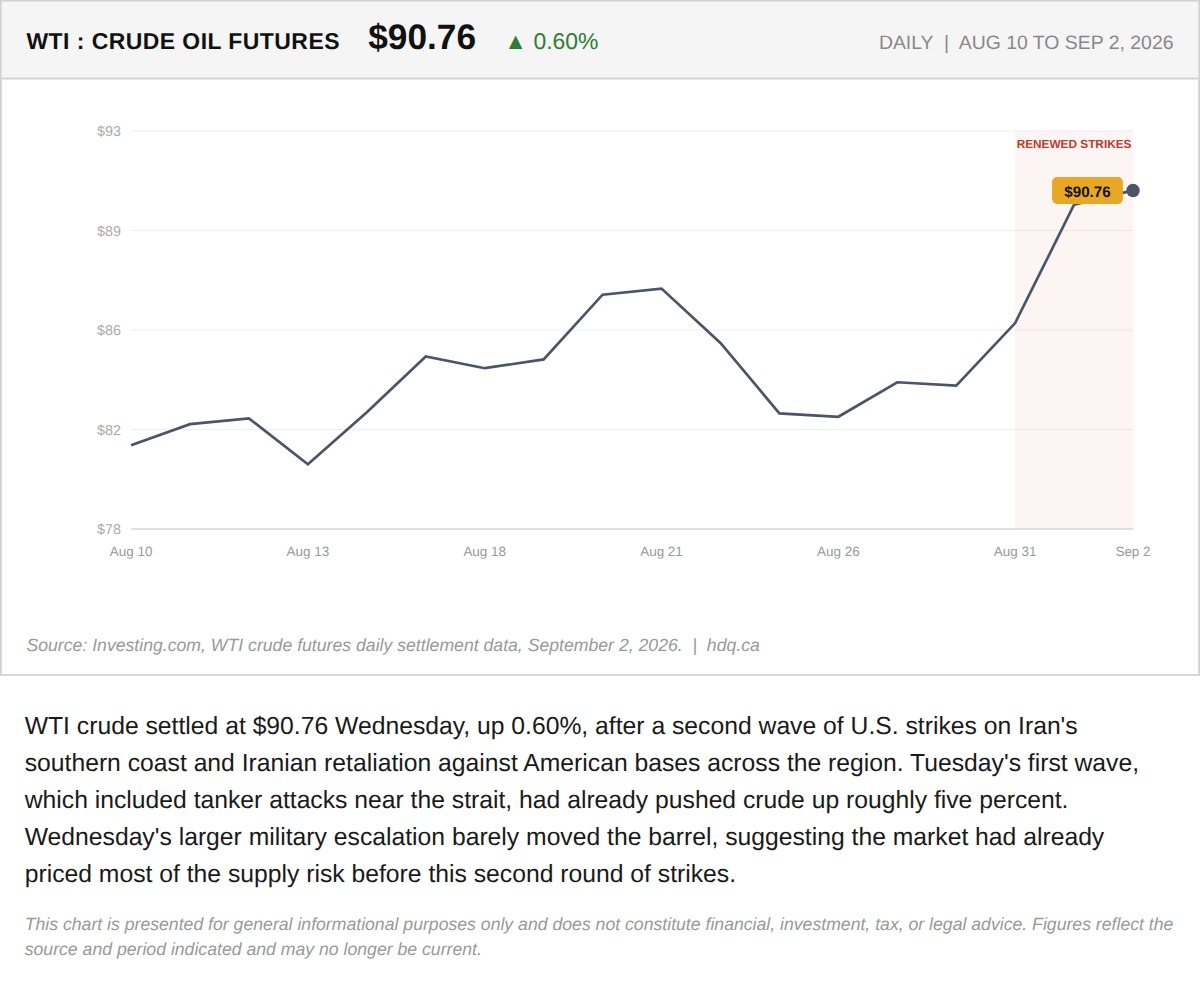
WTI crude settled at $90.76 Wednesday, up 0.60%, after a second wave of U.S.
WTI Crude Adds 0.60% as a Second Wave of Strikes Near Iran Barely Moves the Barrel
September 2, 2026
View chart & download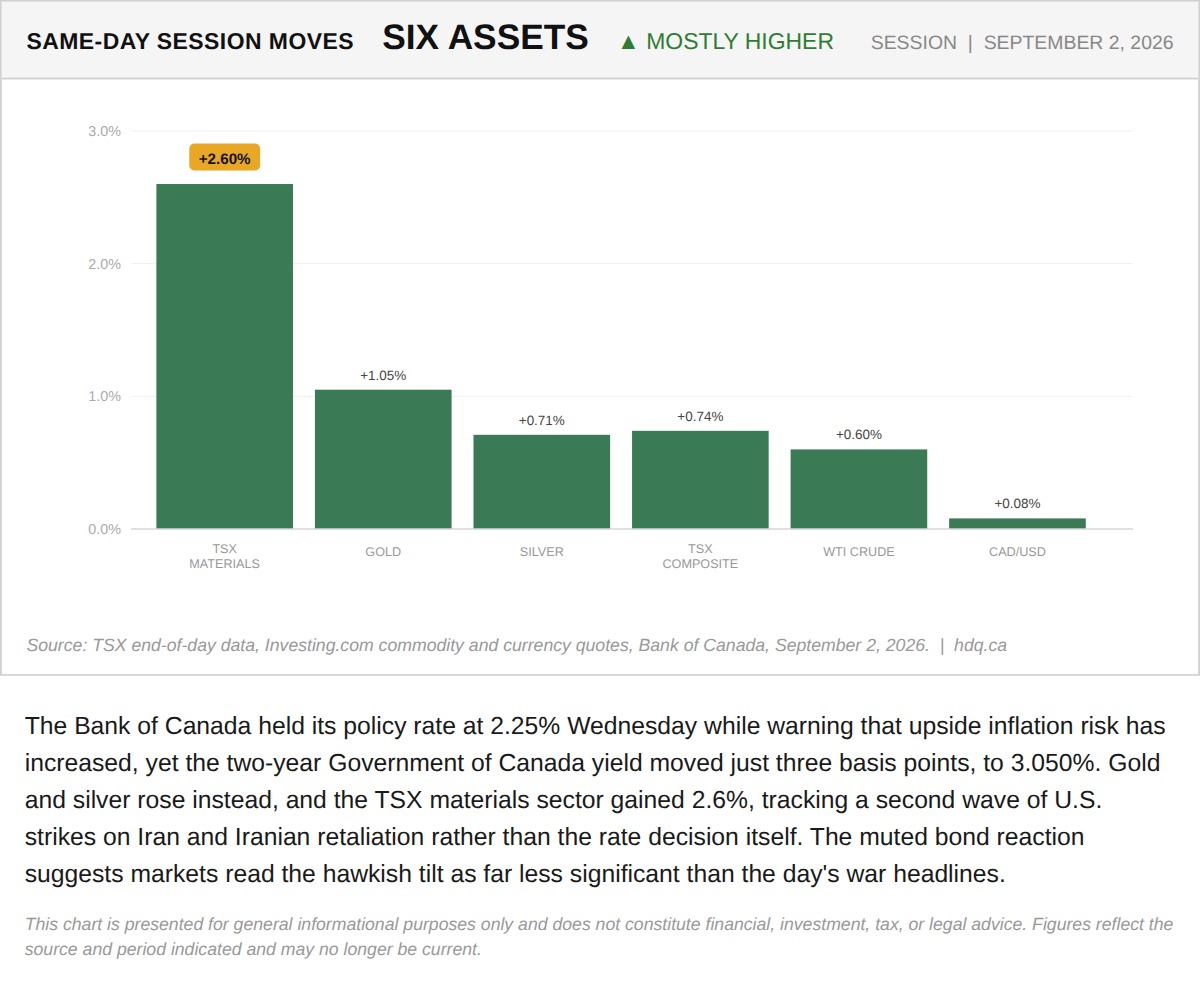
The Bank of Canada held its policy rate at 2.25% Wednesday while warning that upside inflation risk has increased, yet the two-year…
TSX Materials, Gold and Silver Lead a Broad Same-Day Rally Across Six Assets
September 2, 2026
View chart & download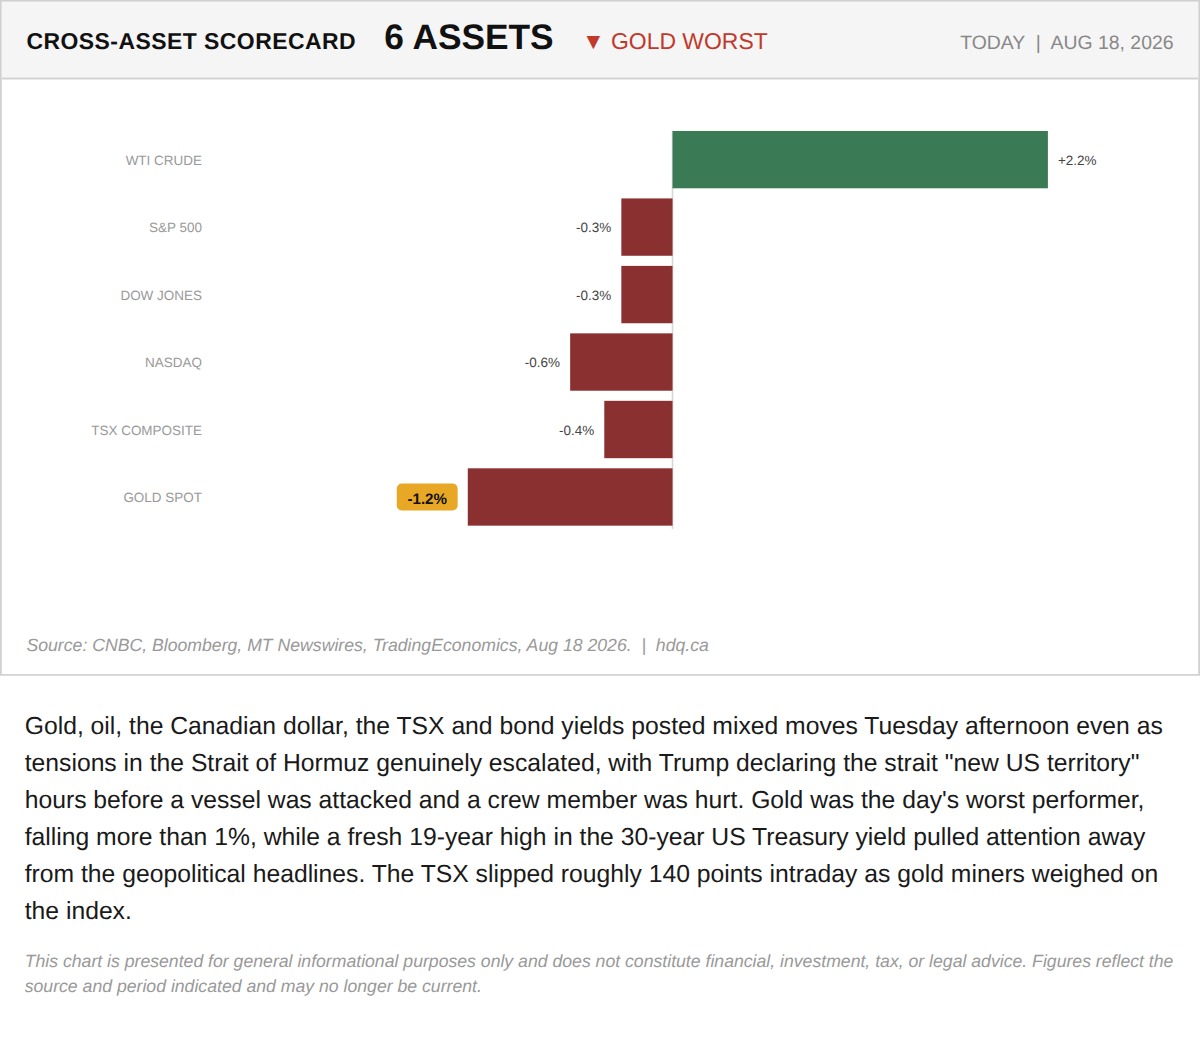
Gold, oil, the Canadian dollar, the TSX and bond yields posted mixed moves Tuesday afternoon even as tensions in the Strait of Hormuz…
Cross-Asset Scorecard as Hormuz Escalates
August 18, 2026
View chart & download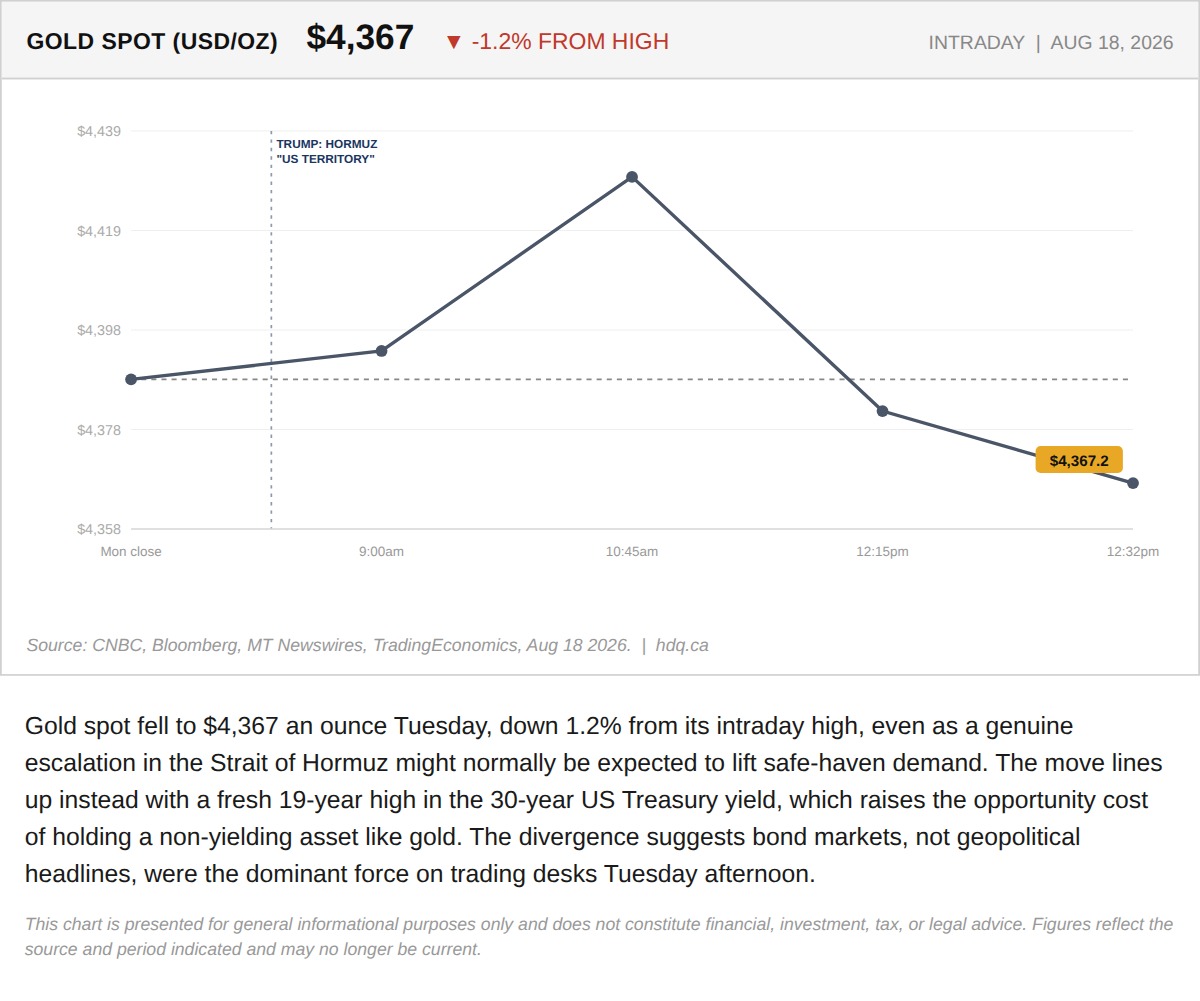
Gold spot fell to $4,367 an ounce Tuesday, down 1.2% from its intraday high, even as a genuine escalation in the Strait of Hormuz might…
Gold Falls as Treasury Yields Hit a 19-Year High
August 18, 2026
View chart & download
The S&P/TSX Composite closed July at 35,226, up 1.06% for the month, a modest headline figure that conceals sharp intra-month swings.
S&P/TSX Composite closes July up 1.06% after a volatile month
July 31, 2026
View chart & download