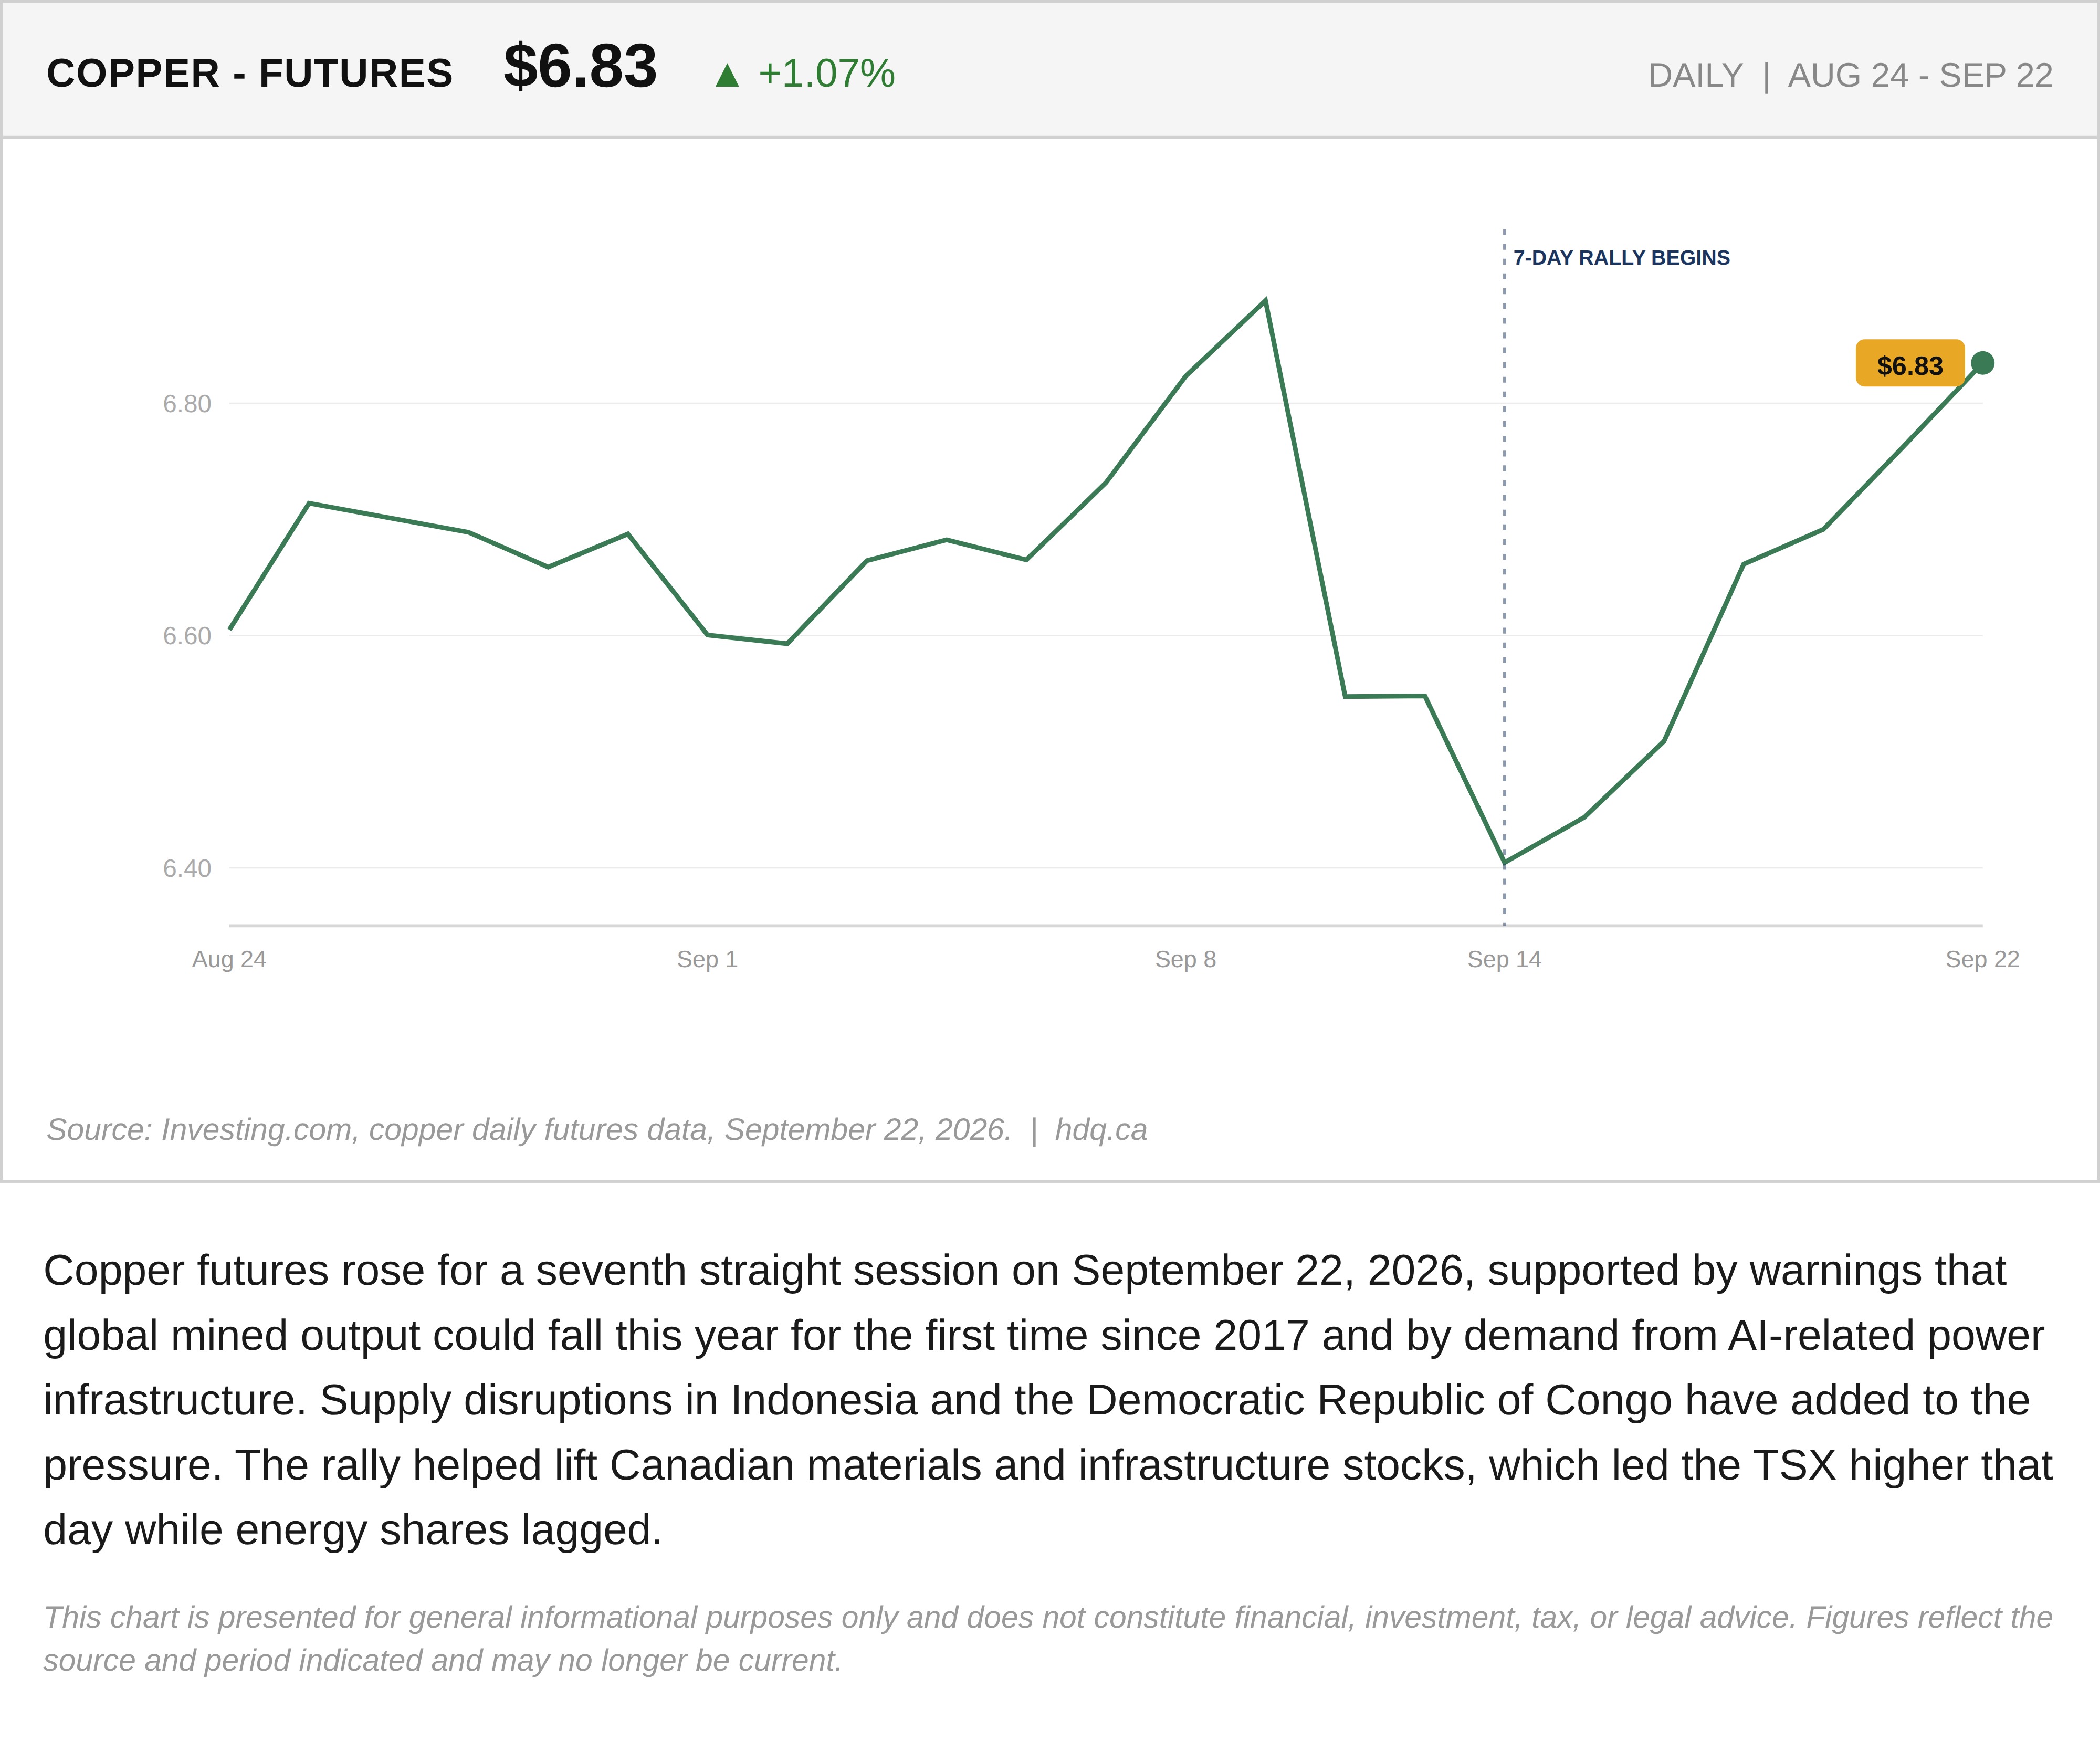
Copper futures rose for a seventh straight session on September 22, 2026, supported by warnings that global mined output could fall this year for the first time since 2017 and by demand from AI-related power infrastructure. Supply disruptions in Indonesia and the Democratic Republic of Congo have added to the pressure. The rally helped lift Canadian materials and infrastructure stocks, which led the TSX higher that day while energy shares lagged.
This chart is presented for general informational purposes only and does not constitute financial, investment, tax, or legal advice. Figures reflect the source and period indicated and may no longer be current.
Related charts
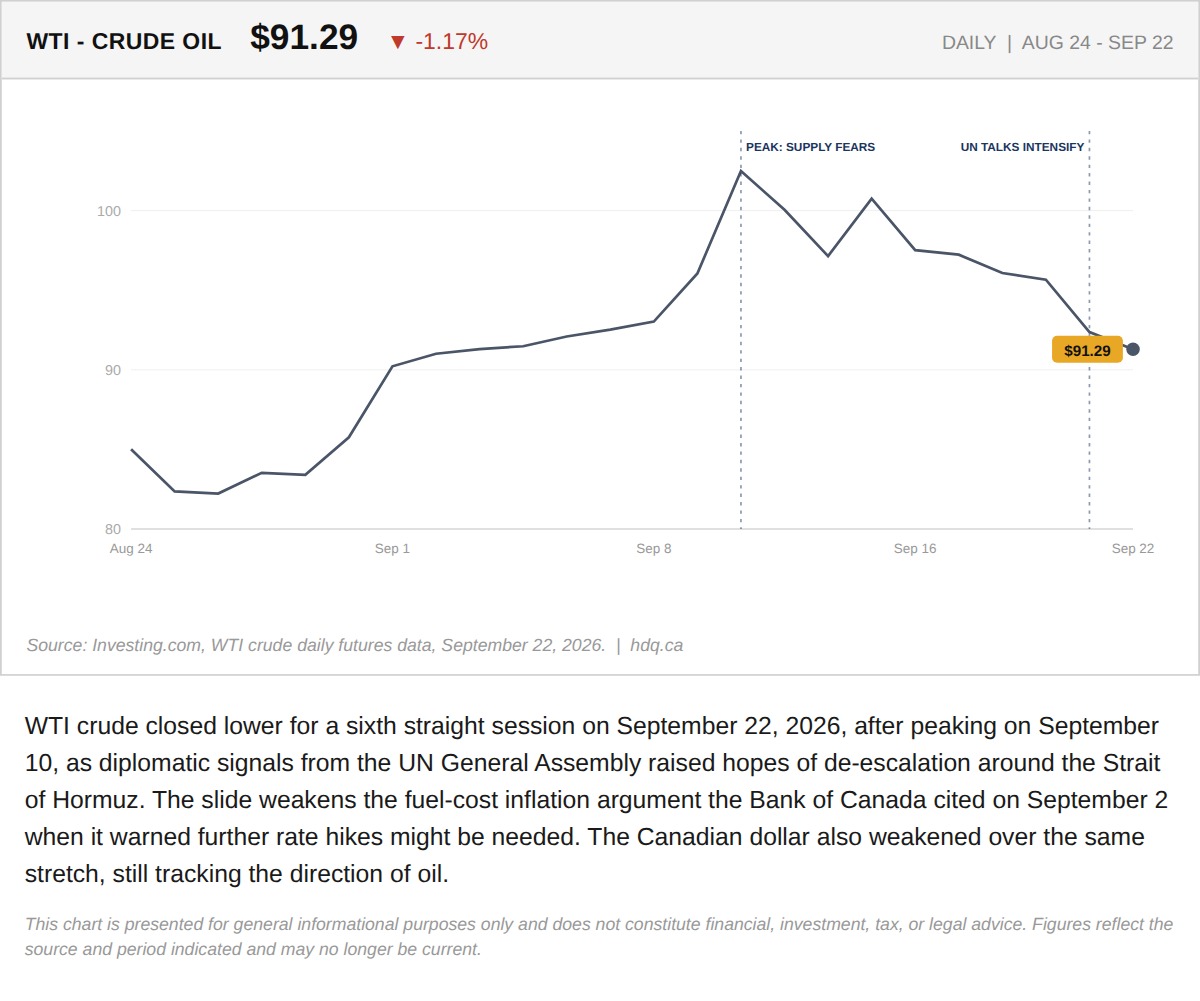
WTI crude closed lower for a sixth straight session on September 22, 2026, after peaking on September 10, as diplomatic signals from the UN…
WTI Crude Falls for Six Straight Sessions on Hormuz De-escalation Hopes
September 22, 2026
View chart & download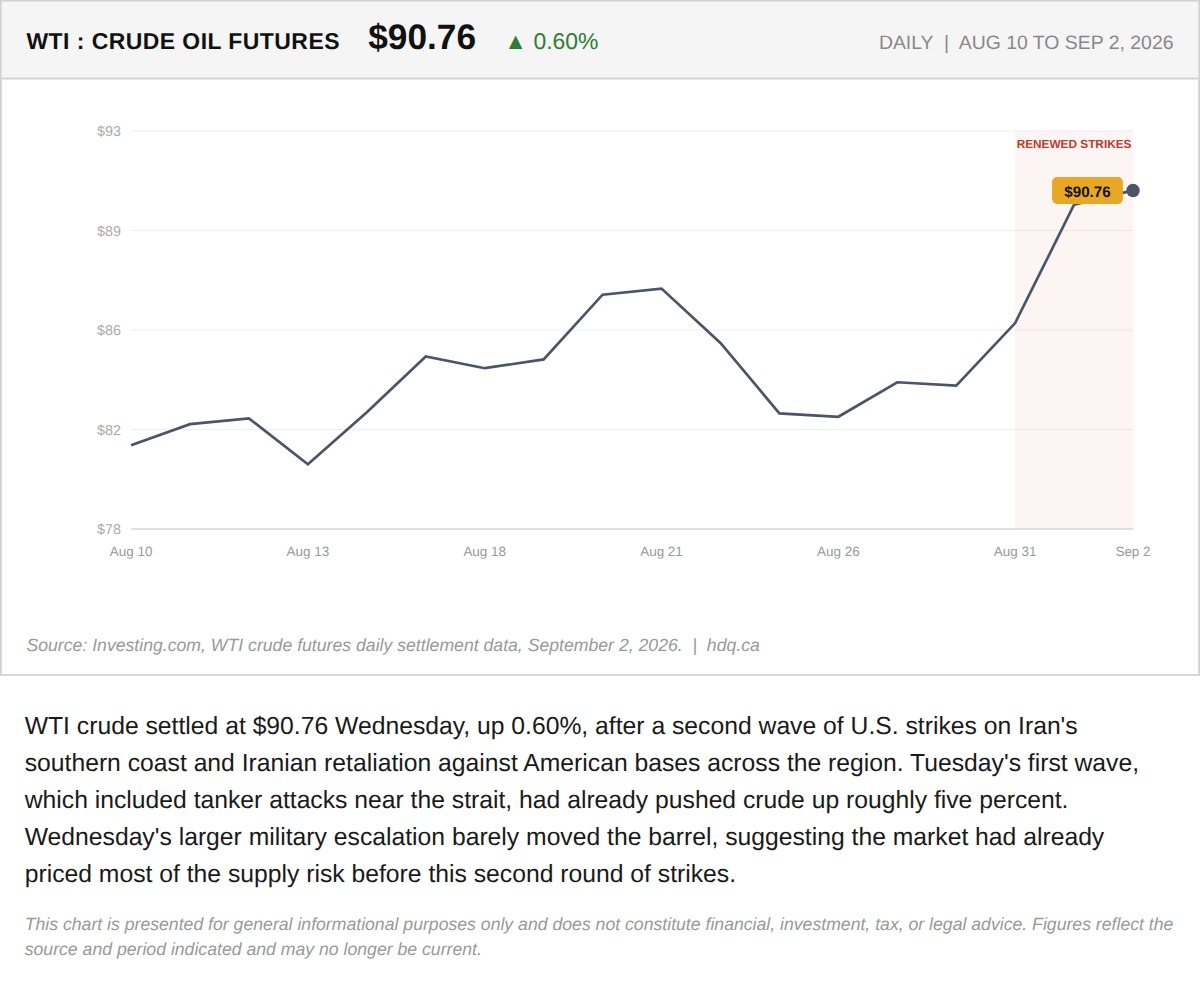
WTI crude settled at $90.76 Wednesday, up 0.60%, after a second wave of U.S.
WTI Crude Adds 0.60% as a Second Wave of Strikes Near Iran Barely Moves the Barrel
September 2, 2026
View chart & download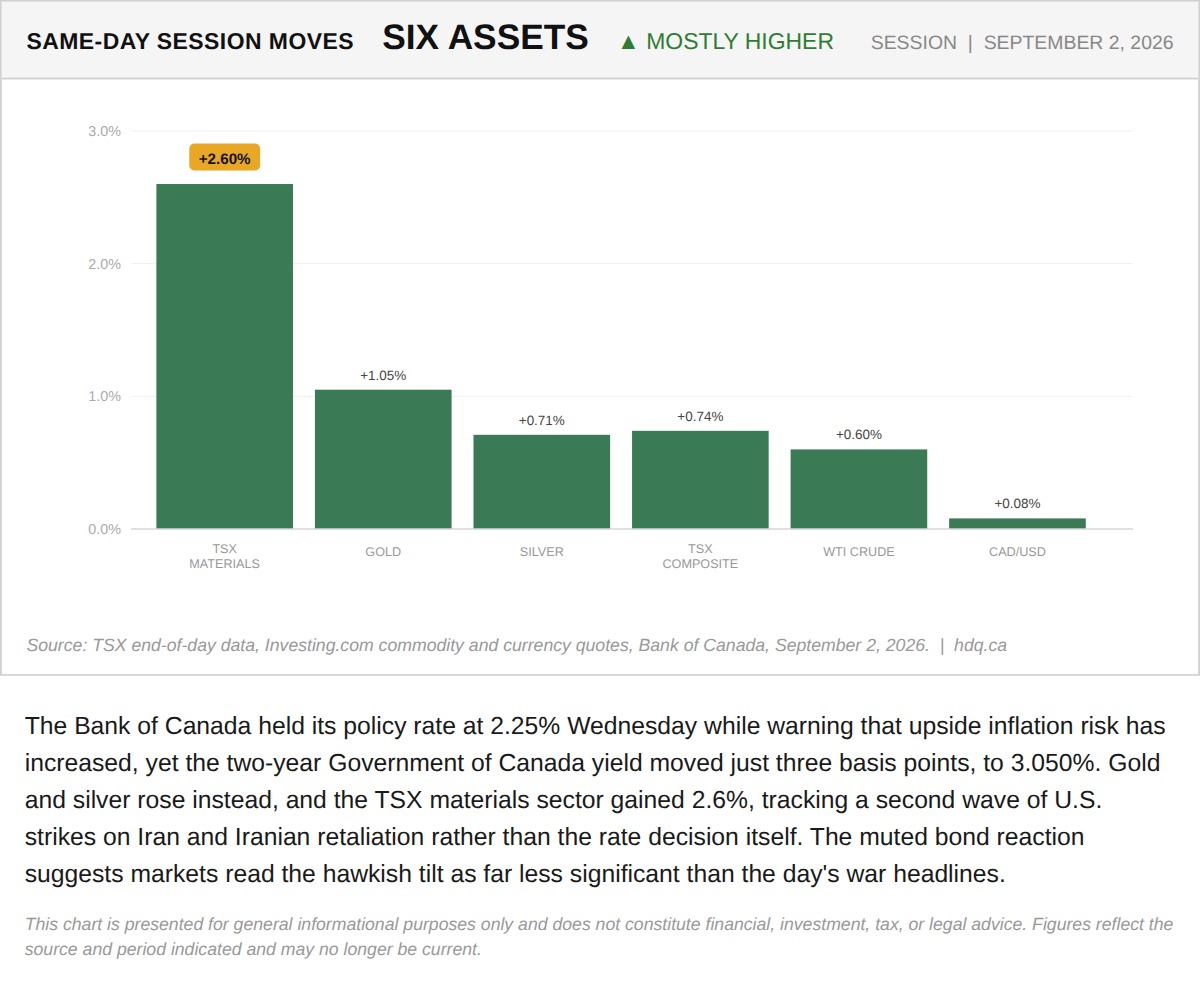
The Bank of Canada held its policy rate at 2.25% Wednesday while warning that upside inflation risk has increased, yet the two-year…
TSX Materials, Gold and Silver Lead a Broad Same-Day Rally Across Six Assets
September 2, 2026
View chart & download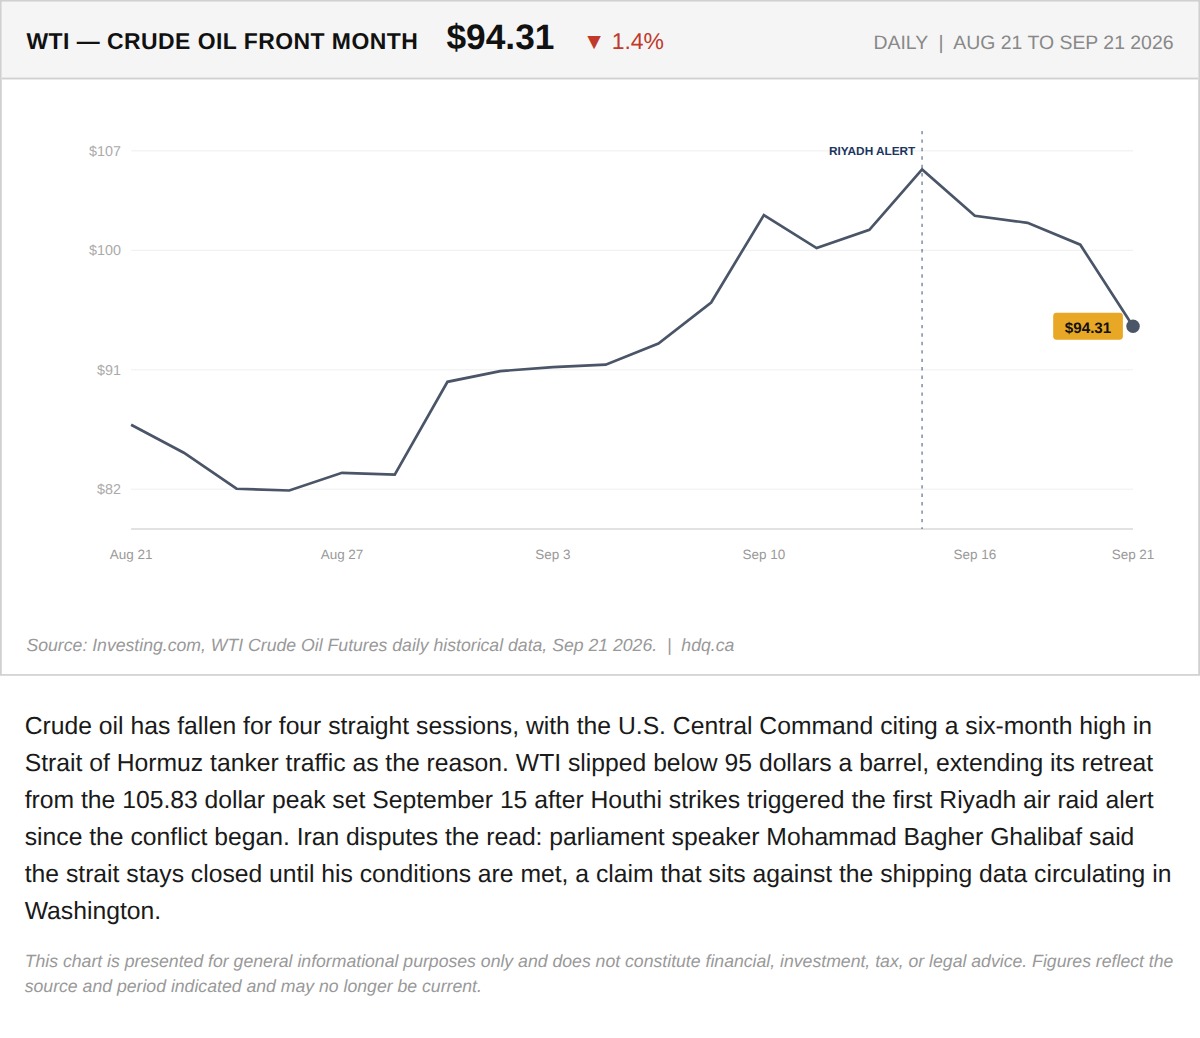
Crude oil has fallen for four straight sessions, with the U.S.
Oil Falls for a Fourth Session as Hormuz Shipping Data Is Disputed
September 21, 2026
View chart & download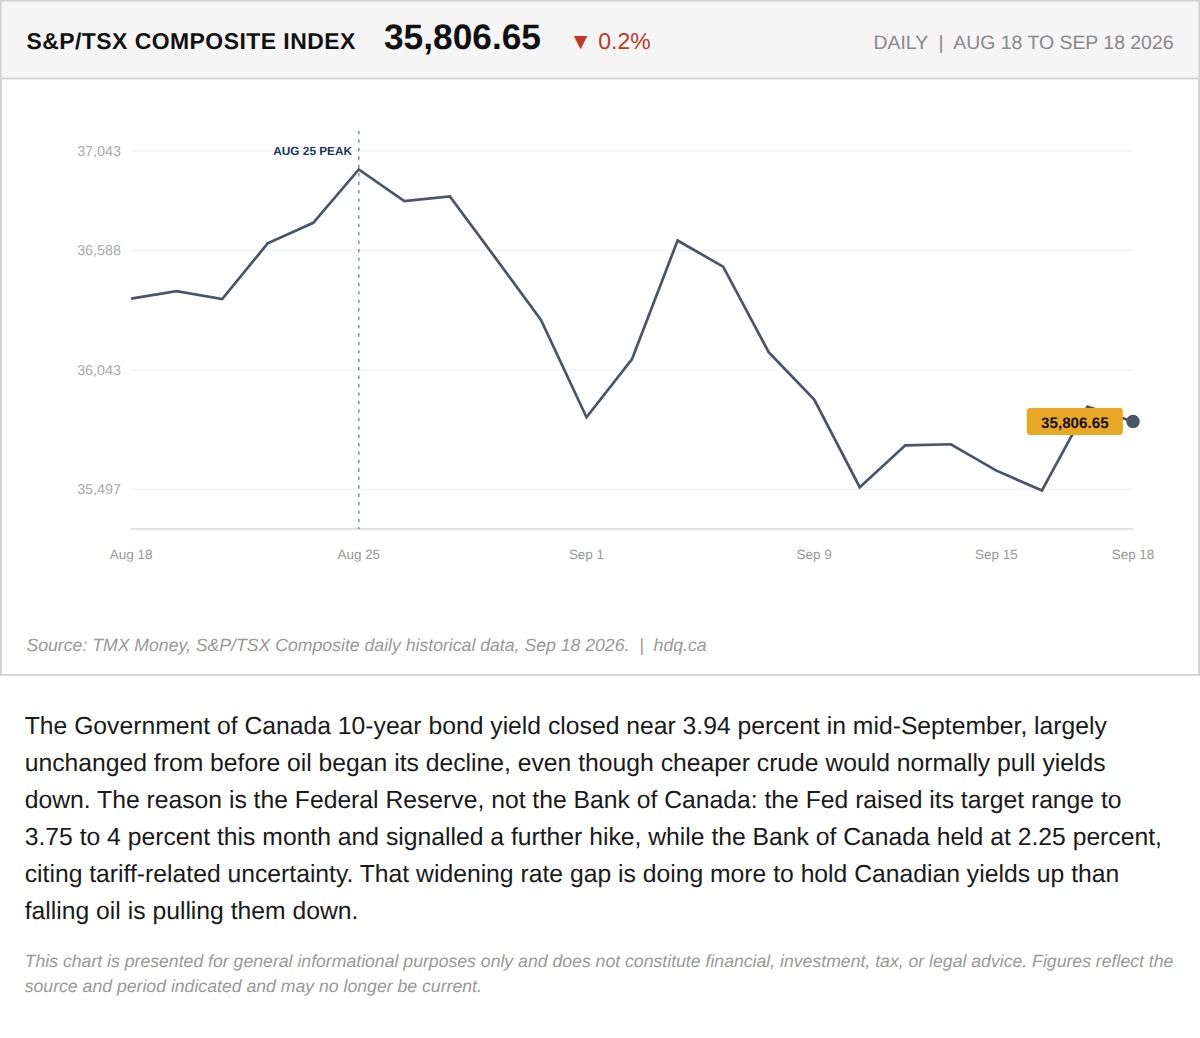
The Government of Canada 10-year bond yield closed near 3.94 percent in mid-September, largely unchanged from before oil began its decline,…
TSX Slides as Canadian Bond Yields Stay Elevated Despite Falling Oil
September 21, 2026
View chart & download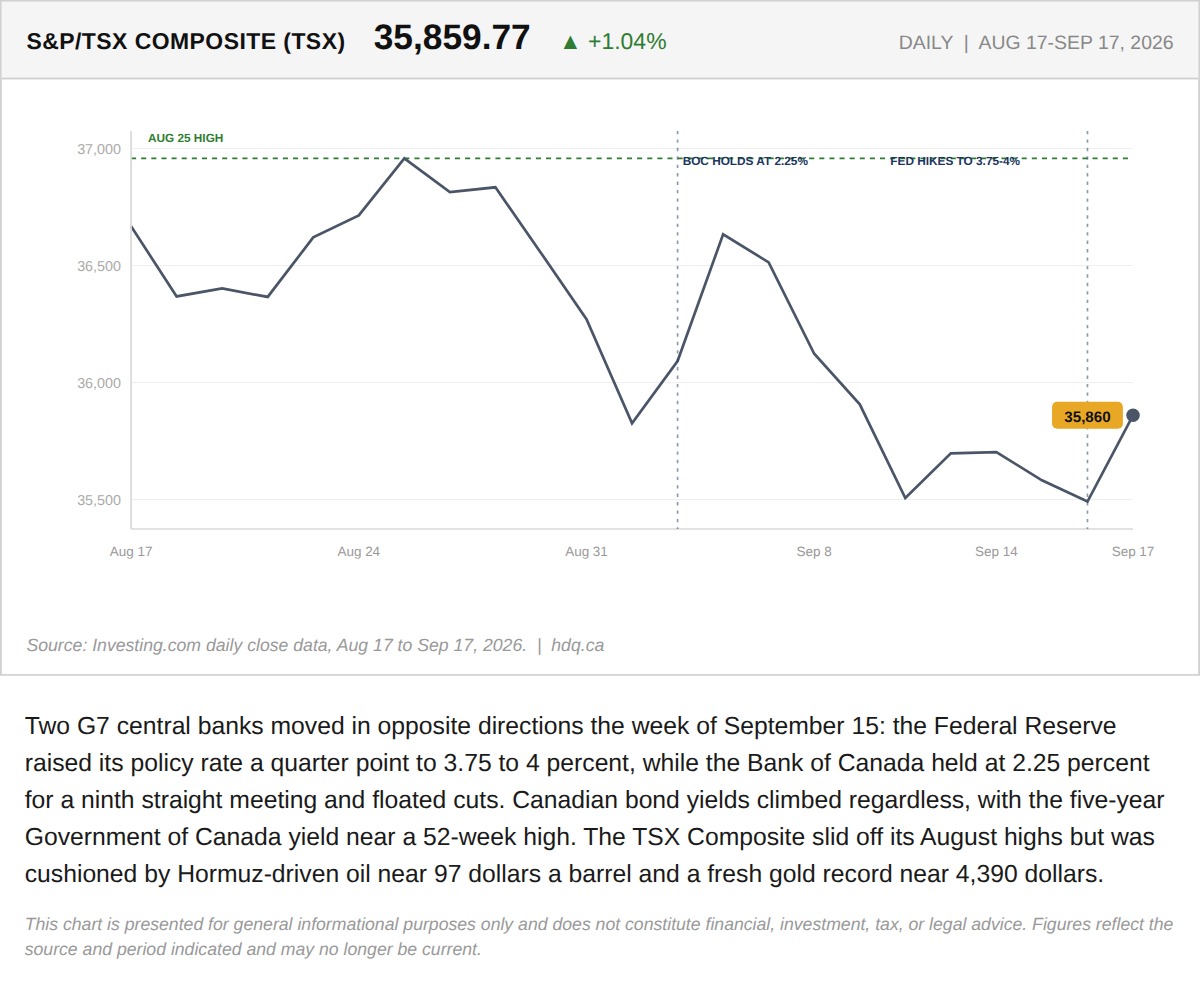
Two G7 central banks moved in opposite directions the week of September 15: the Federal Reserve raised its policy rate a quarter point to…
The Week the Bank of Canada's Own Rate Stopped Setting Canadian Borrowing Costs
September 19, 2026
View chart & download