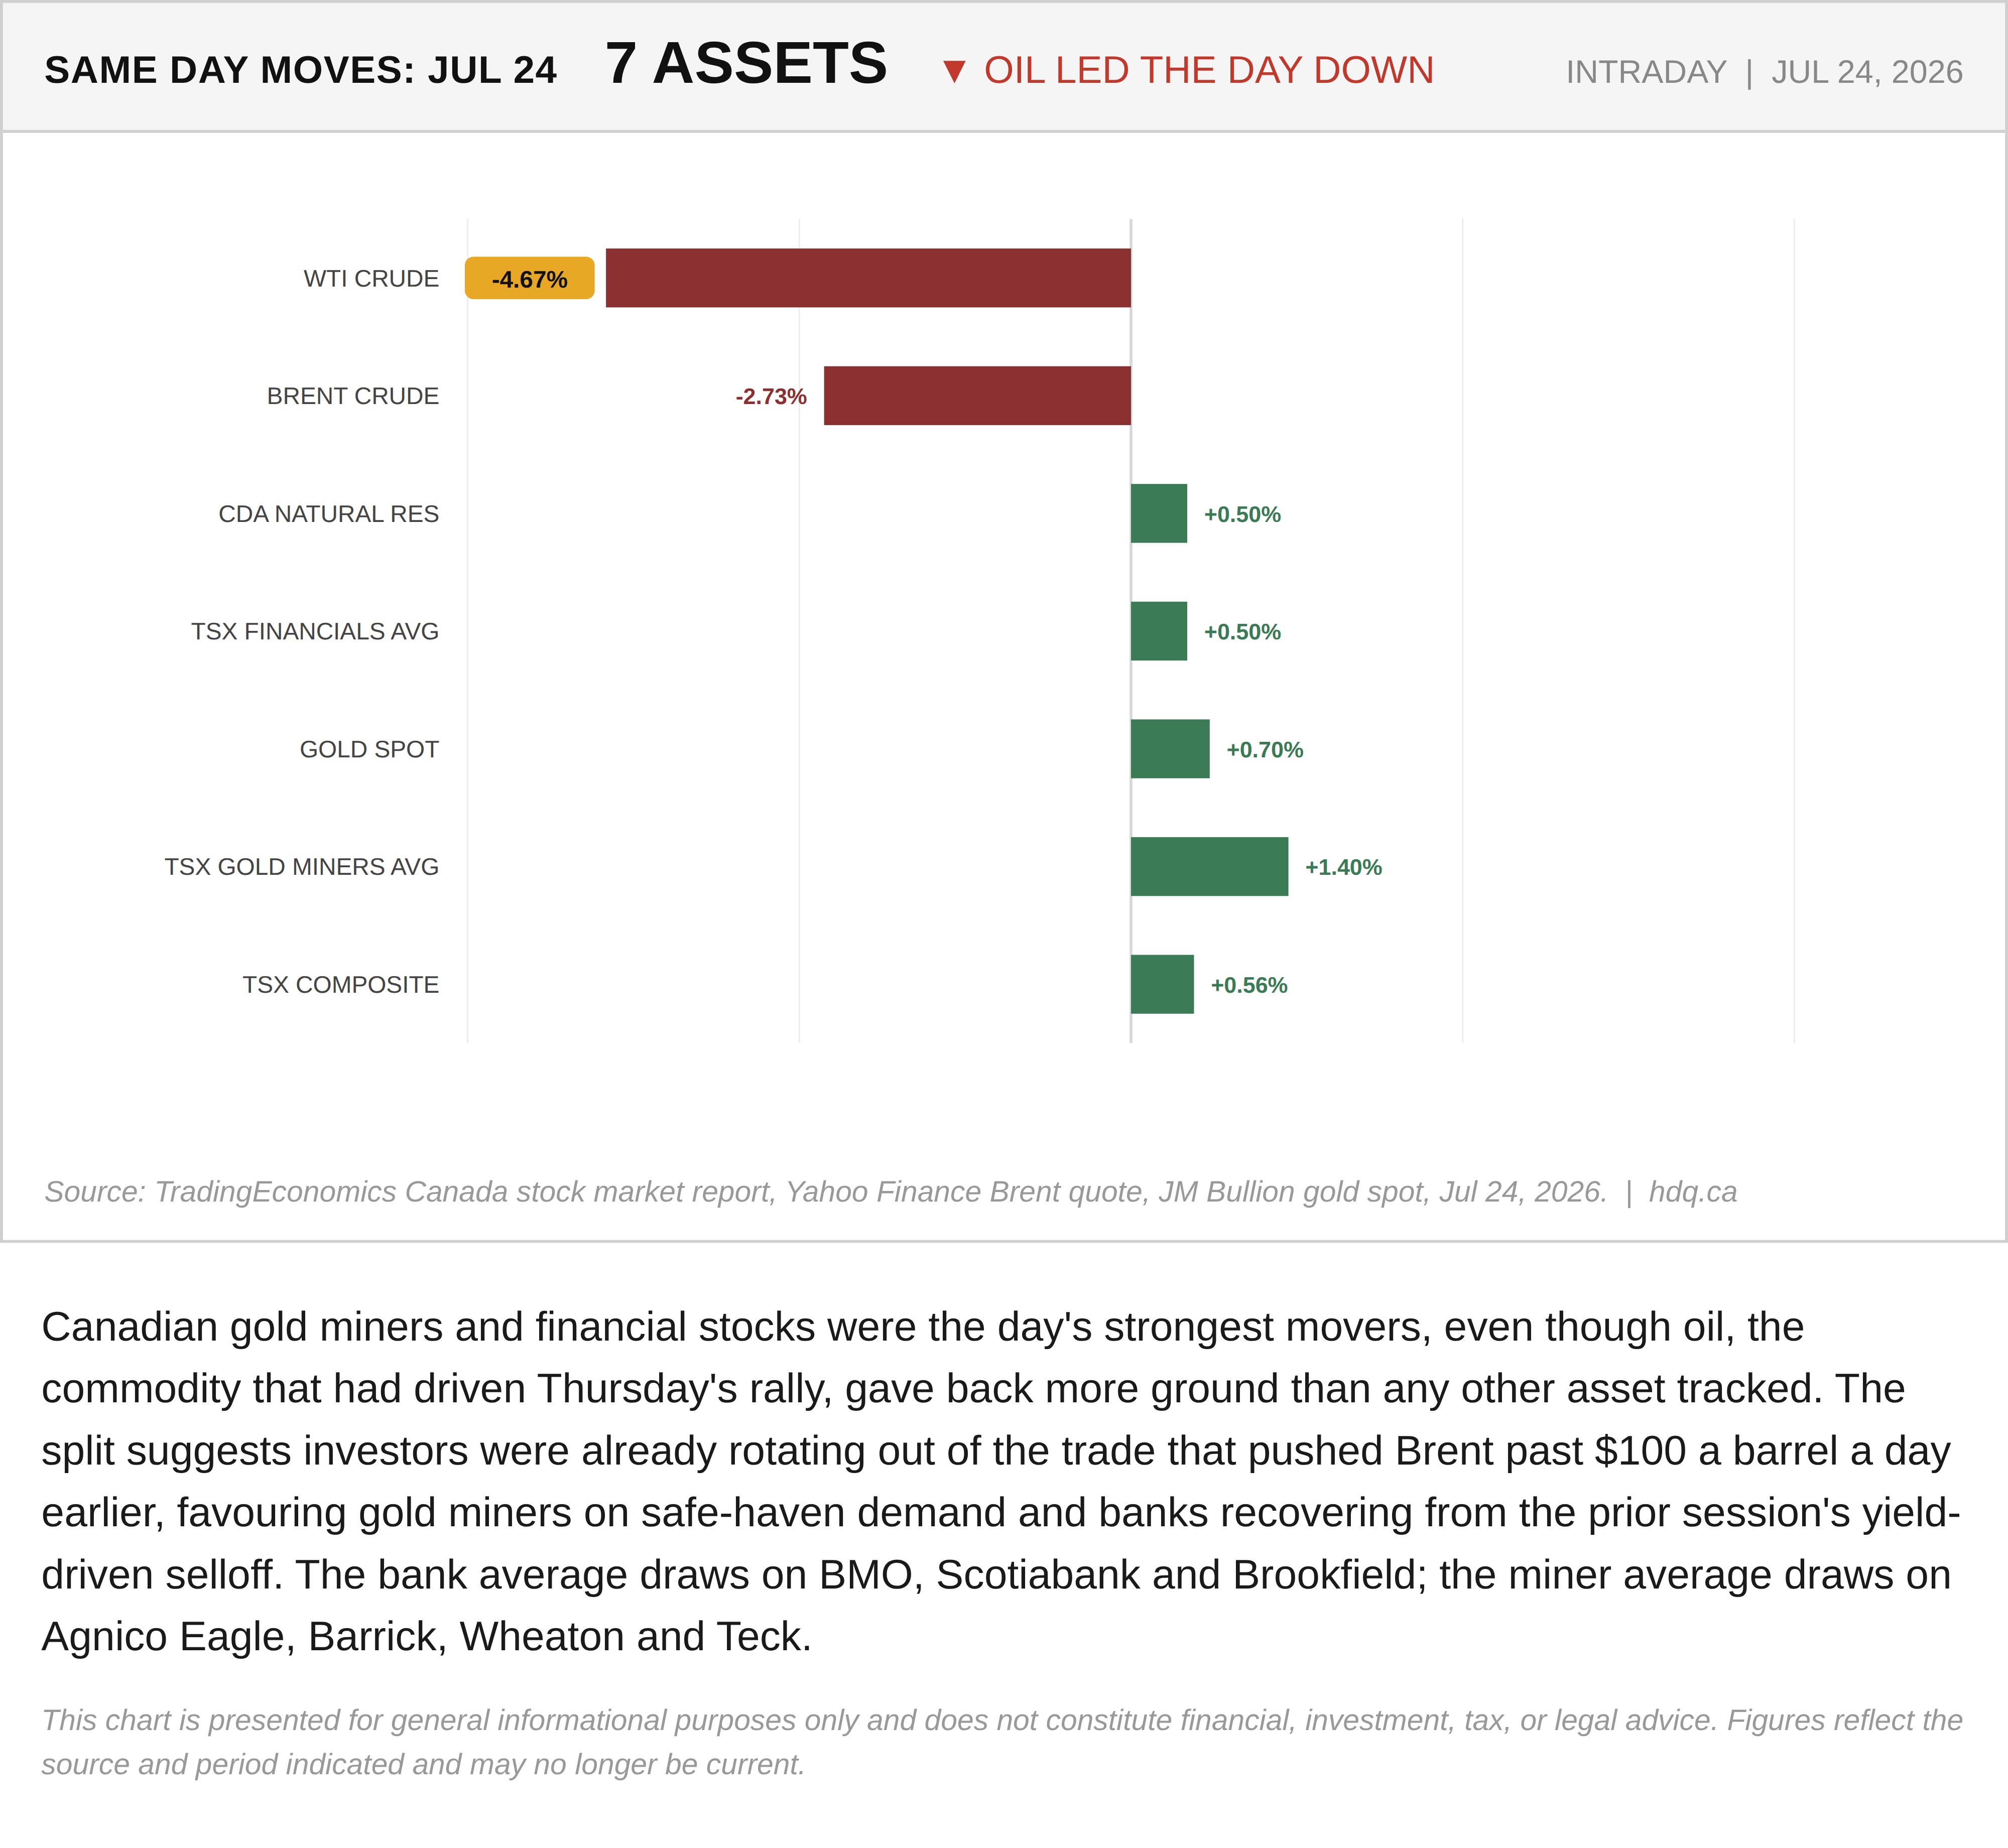
Canadian gold miners and financial stocks were the day's strongest movers, even though oil, the commodity that had driven Thursday's rally, gave back more ground than any other asset tracked. The split suggests investors were already rotating out of the trade that pushed Brent past $100 a barrel a day earlier, favouring gold miners on safe-haven demand and banks recovering from the prior session's yield-driven selloff. The bank average draws on BMO, Scotiabank and Brookfield; the miner average draws on Agnico Eagle, Barrick, Wheaton and Teck.
This chart is presented for general informational purposes only and does not constitute financial, investment, tax, or legal advice. Figures reflect the source and period indicated and may no longer be current.

Related charts
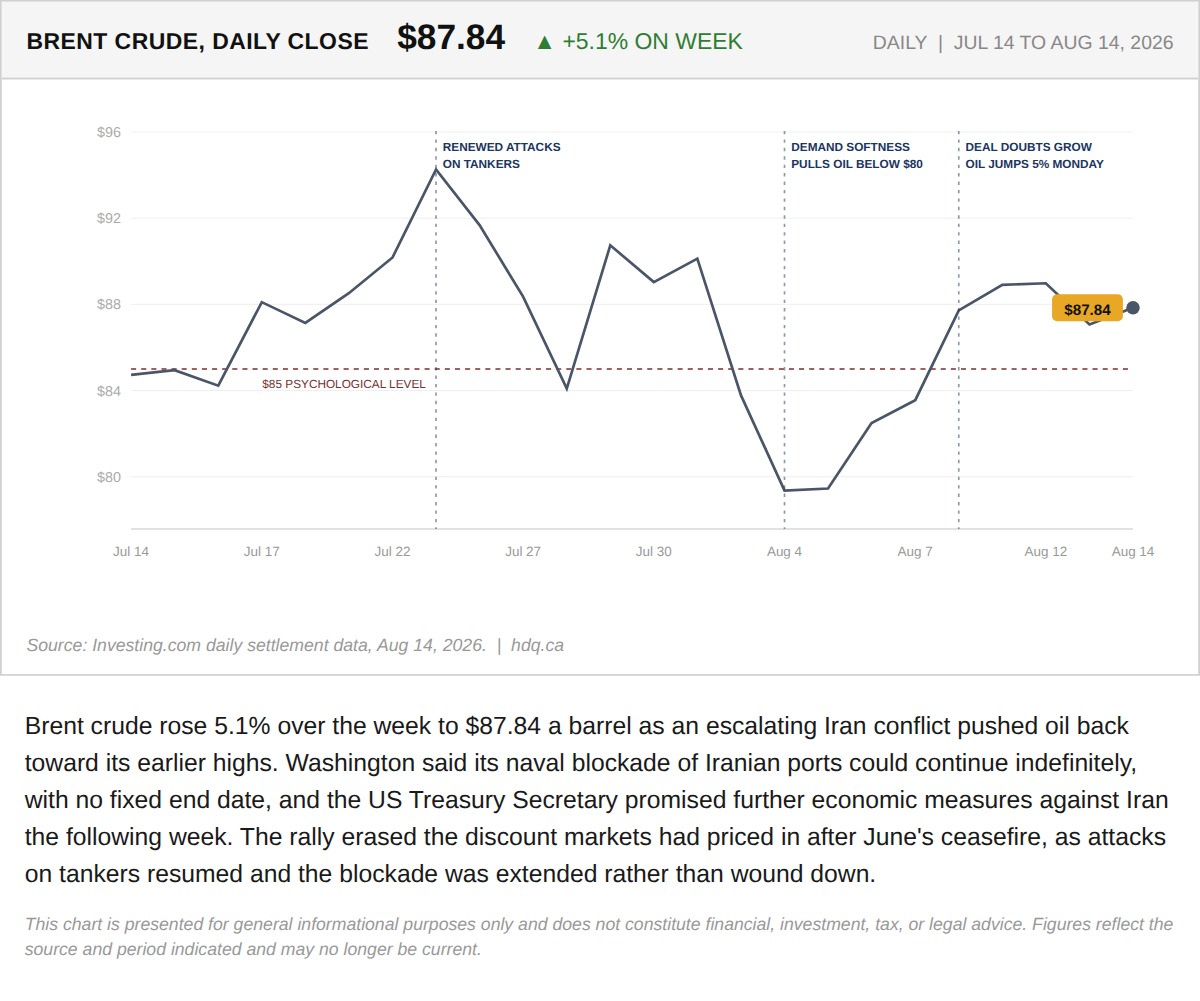
Brent crude rose 5.1% over the week to $87.84 a barrel as an escalating Iran conflict pushed oil back toward its earlier highs.
The TSX and Gold Both Set Records This Week. That Should Not Happen Together.
August 15, 2026
View chart & download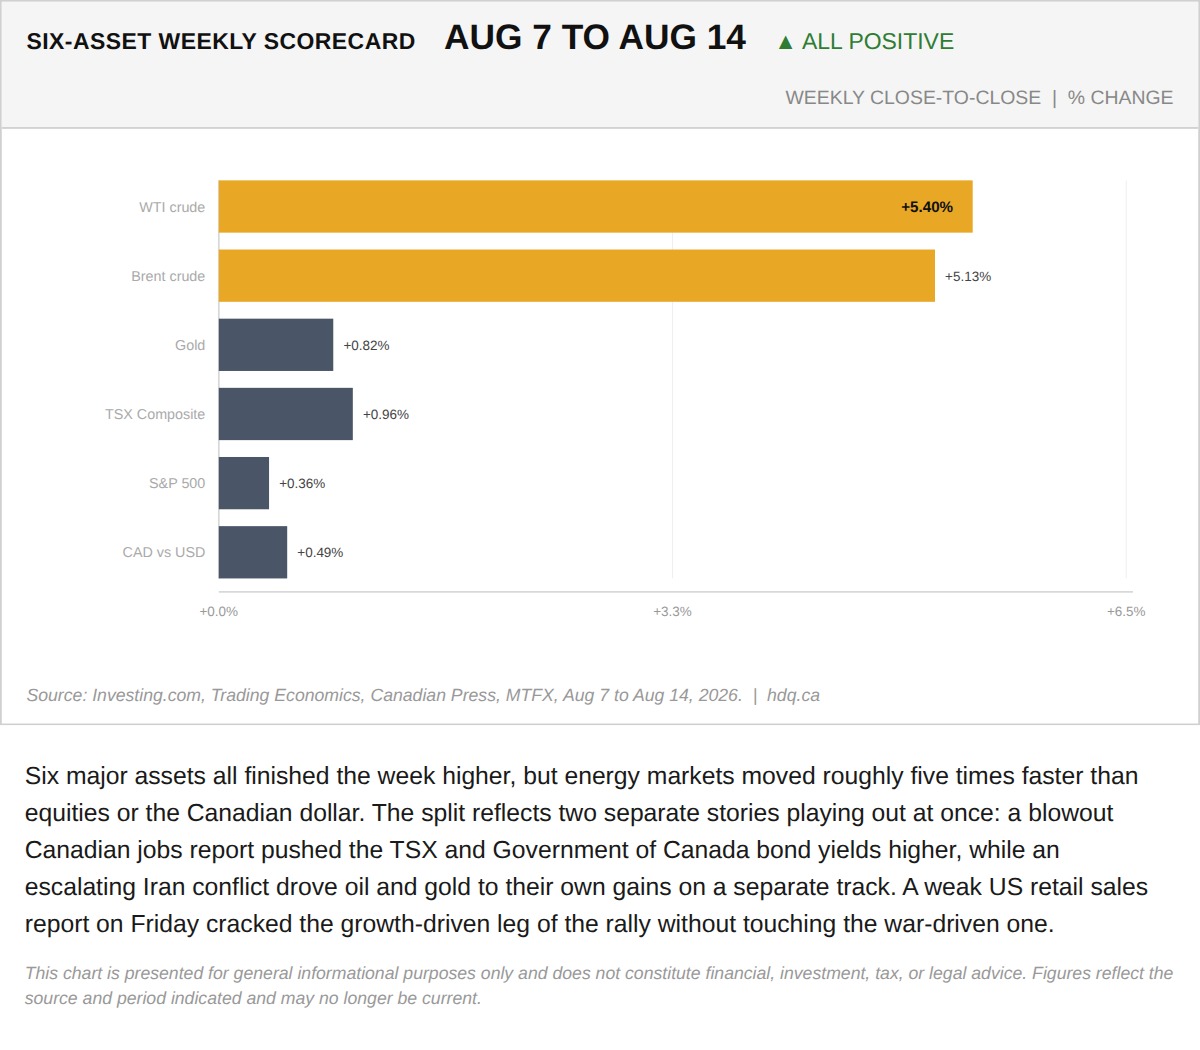
Six major assets all finished the week higher, but energy markets moved roughly five times faster than equities or the Canadian dollar.
The TSX and Gold Both Set Records This Week. That Should Not Happen Together.
August 15, 2026
View chart & download
The S&P/TSX Composite closed July at 35,226, up 1.06% for the month, a modest headline figure that conceals sharp intra-month swings.
S&P/TSX Composite closes July up 1.06% after a volatile month
July 31, 2026
View chart & download
Brent and WTI crude both surged in July, with WTI ending the month at $85.47, up 23.0%, after round-tripping from a five-month low near $68.74.
WTI and Brent crude surge in July as the Iran ceasefire collapses
July 31, 2026
View chart & download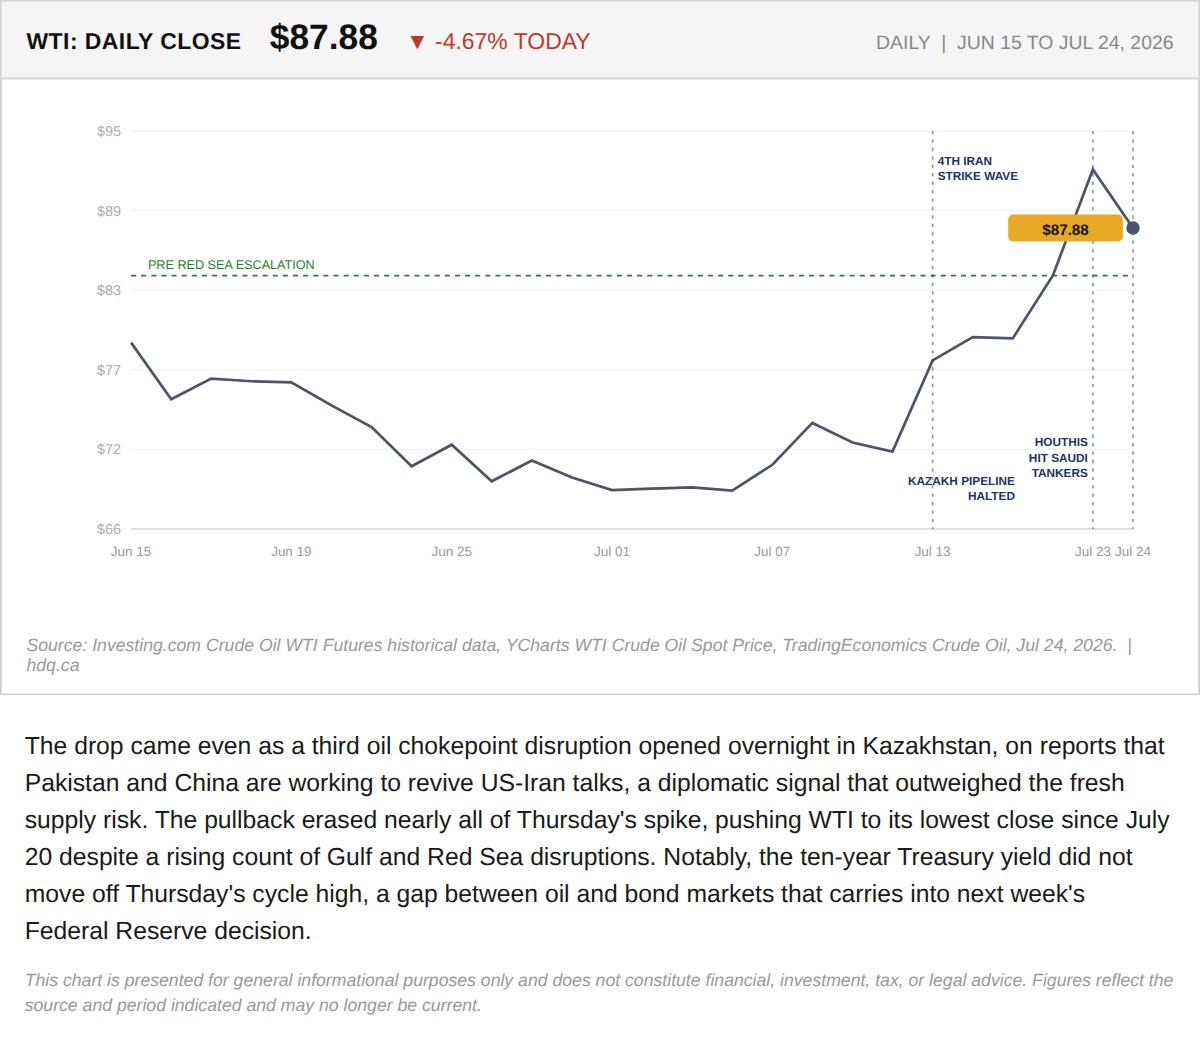
The drop came even as a third oil chokepoint disruption opened overnight in Kazakhstan, on reports that Pakistan and China are working to…
Oil Gave Back the Entire Brent-$100 Spike Today. The Bond Market Did Not Follow.
July 24, 2026
View chart & download
Brent was the only one of the three to finish above its starting level, while the index and gold both fell.
Brent, TSX and Gold Rebased to the August 31 Close
September 30, 2026
View chart & download