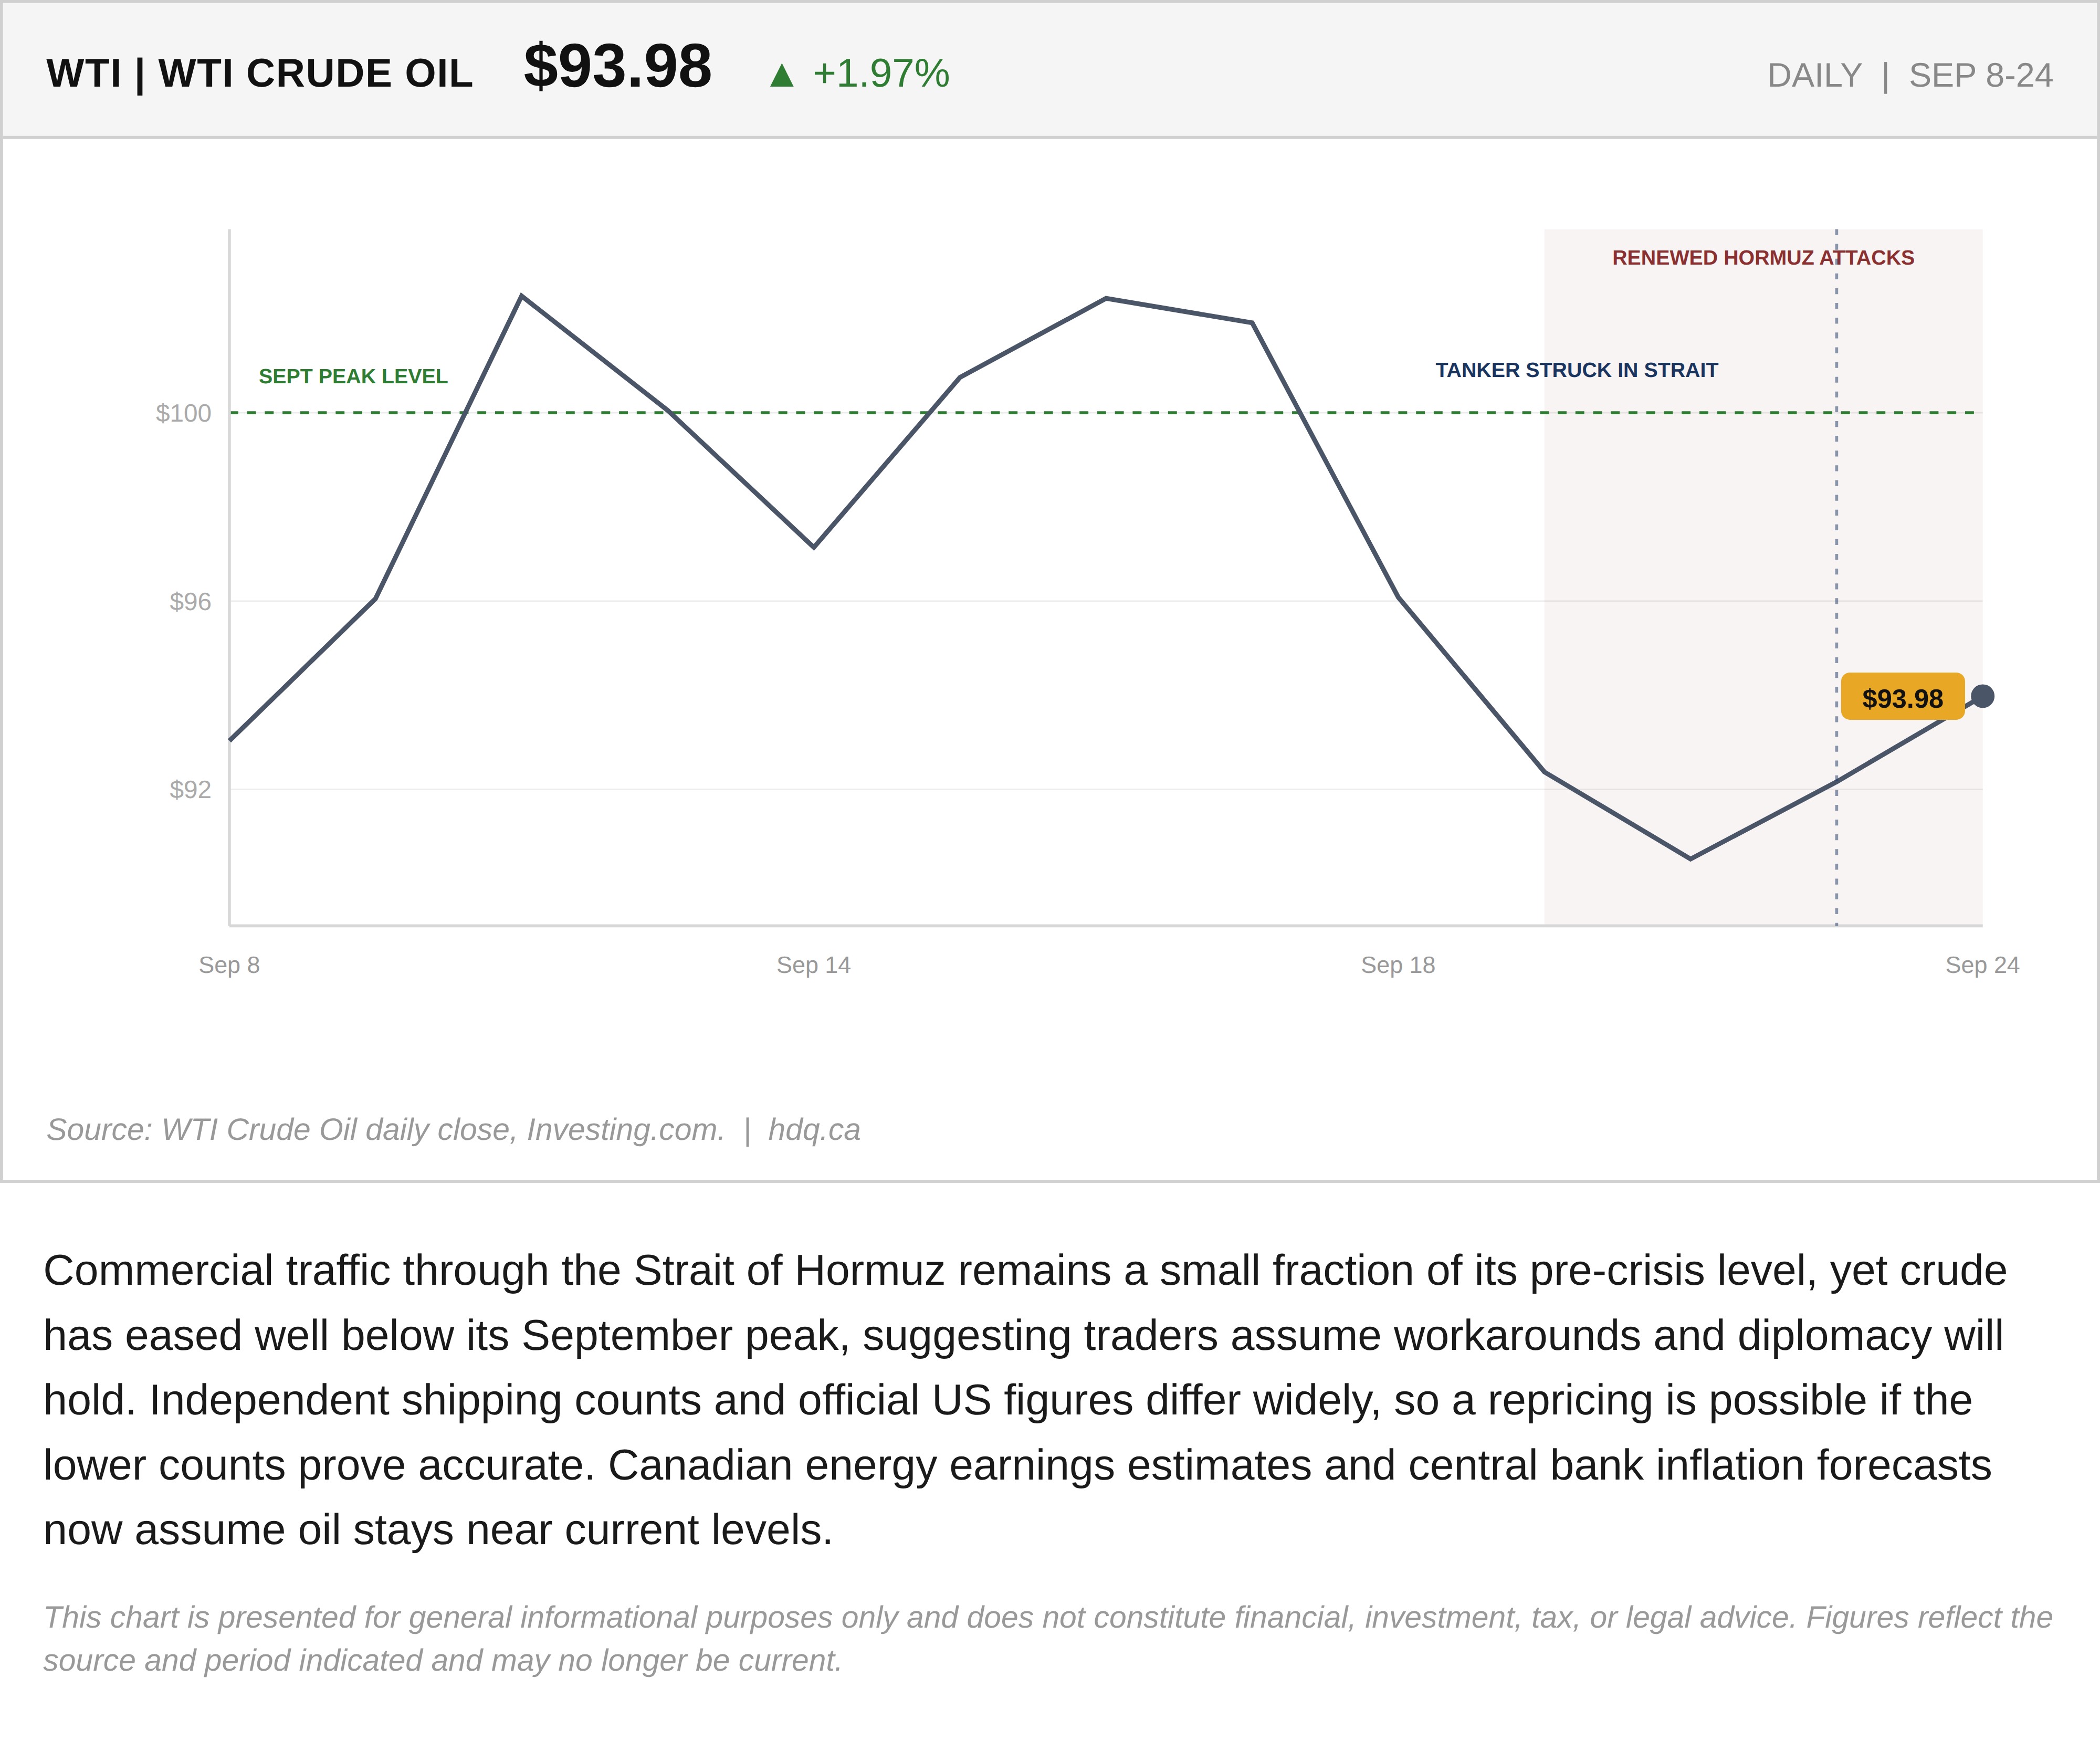
Commercial traffic through the Strait of Hormuz remains a small fraction of its pre-crisis level, yet crude has eased well below its September peak, suggesting traders assume workarounds and diplomacy will hold. Independent shipping counts and official US figures differ widely, so a repricing is possible if the lower counts prove accurate. Canadian energy earnings estimates and central bank inflation forecasts now assume oil stays near current levels.
This chart is presented for general informational purposes only and does not constitute financial, investment, tax, or legal advice. Figures reflect the source and period indicated and may no longer be current.
Related charts
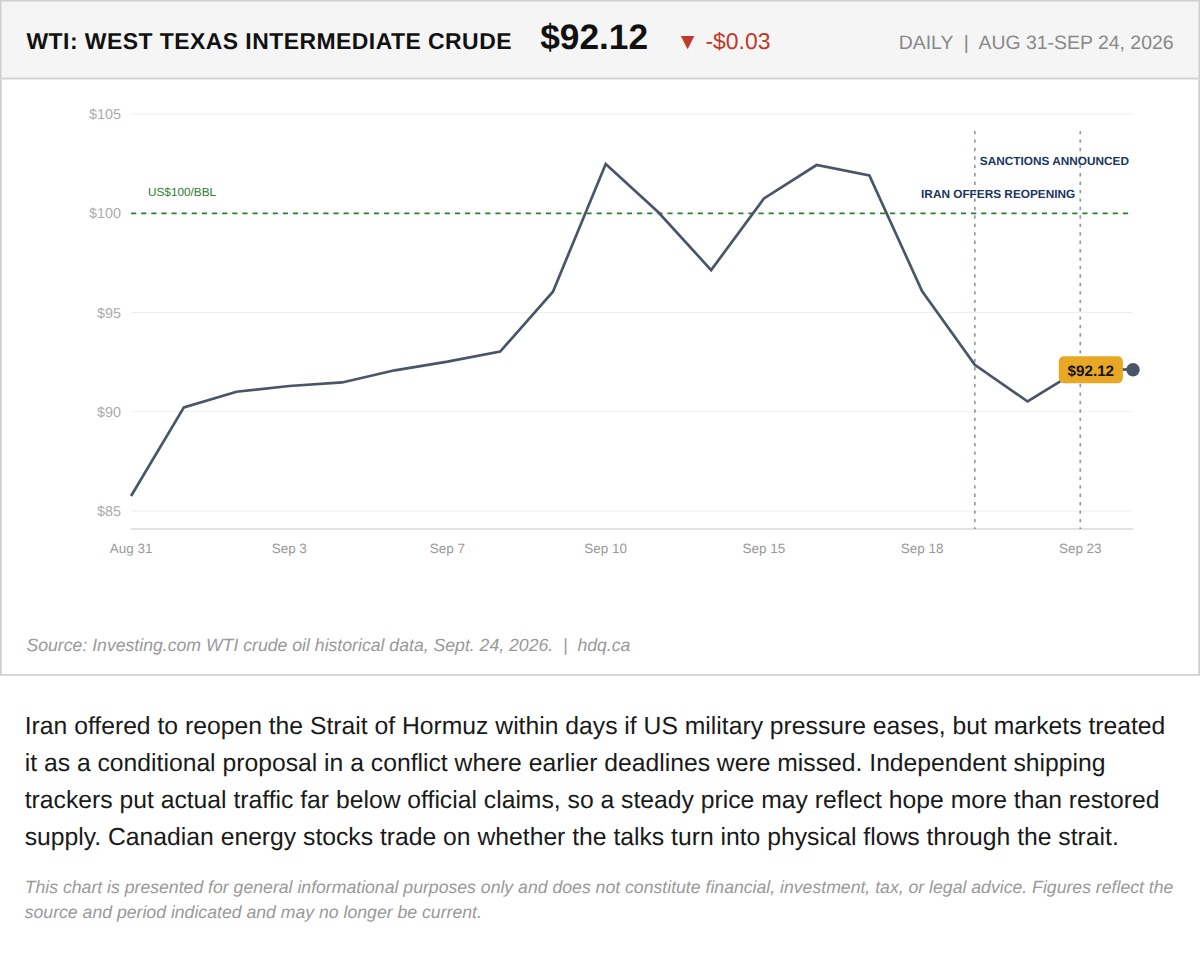
Iran offered to reopen the Strait of Hormuz within days if US military pressure eases, but markets treated it as a conditional proposal in…
WTI Crude Holds Near $92 on Hormuz Reopening Offer
September 24, 2026
View chart & download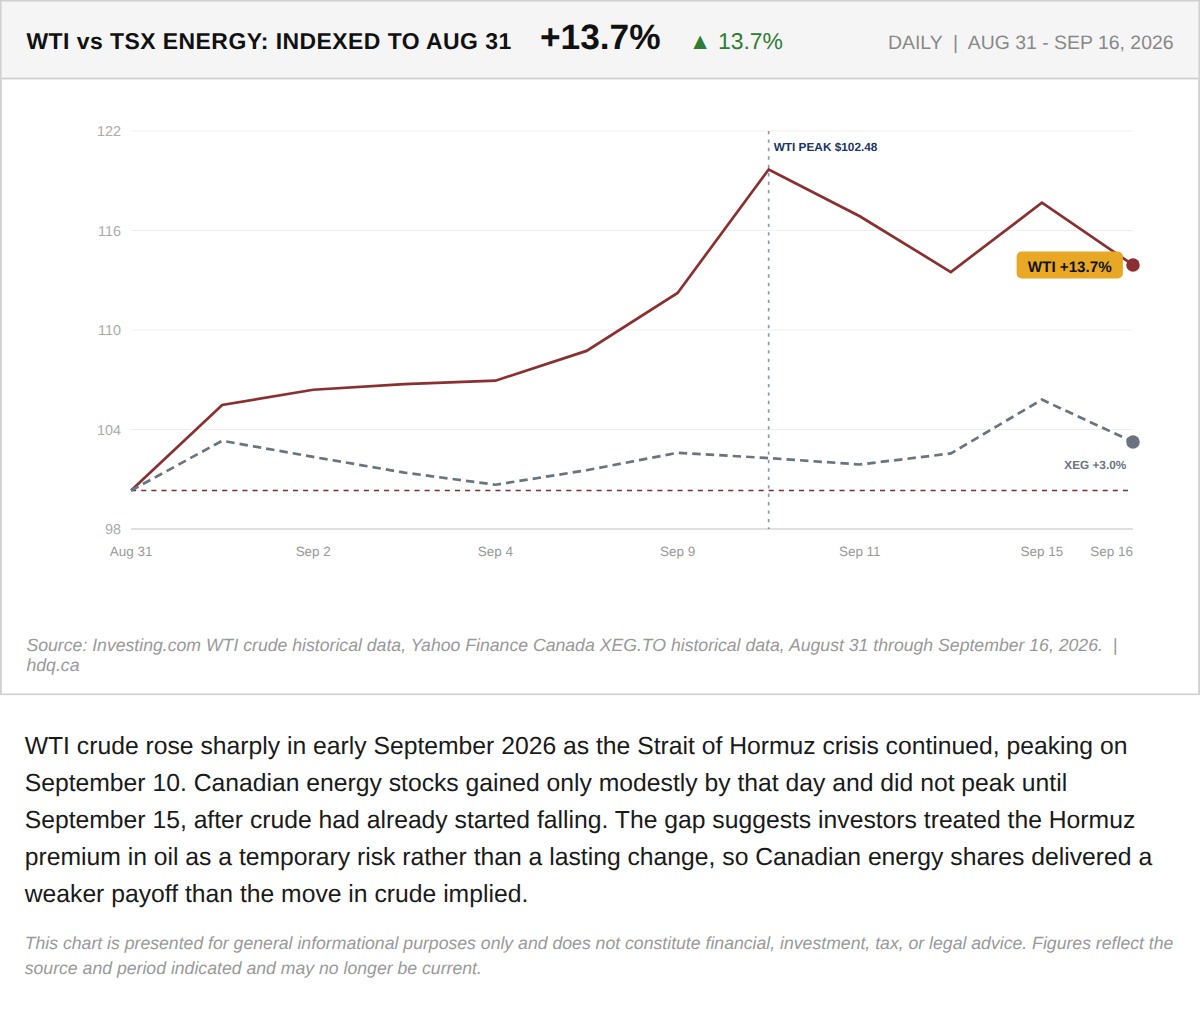
WTI crude rose sharply in early September 2026 as the Strait of Hormuz crisis continued, peaking on September 10.
The Hormuz Premium Did Not Show Up in Canadian Energy Stocks
September 22, 2026
View chart & download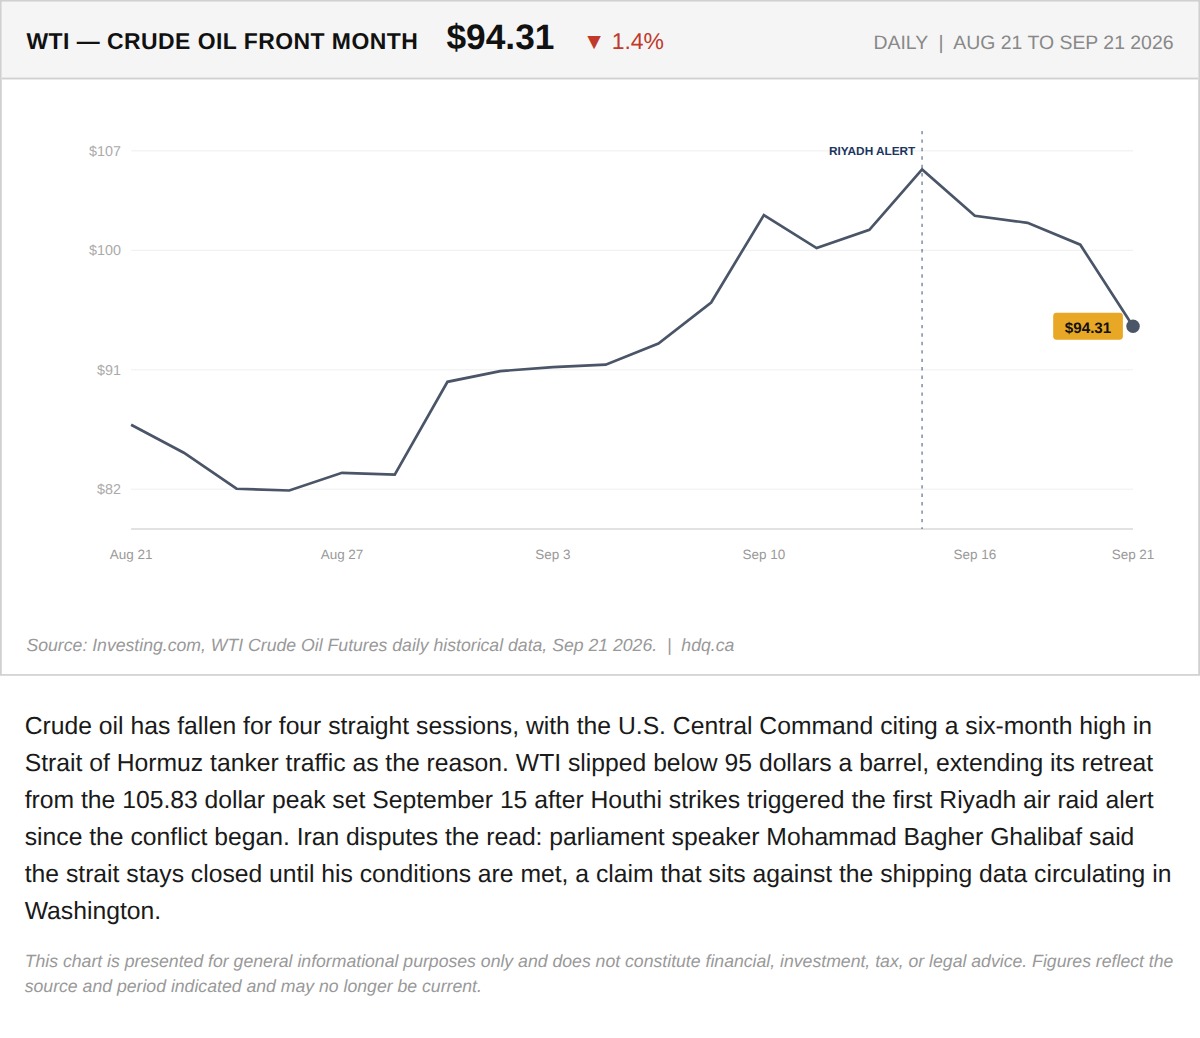
Crude oil has fallen for four straight sessions, with the U.S.
Oil Falls for a Fourth Session as Hormuz Shipping Data Is Disputed
September 21, 2026
View chart & download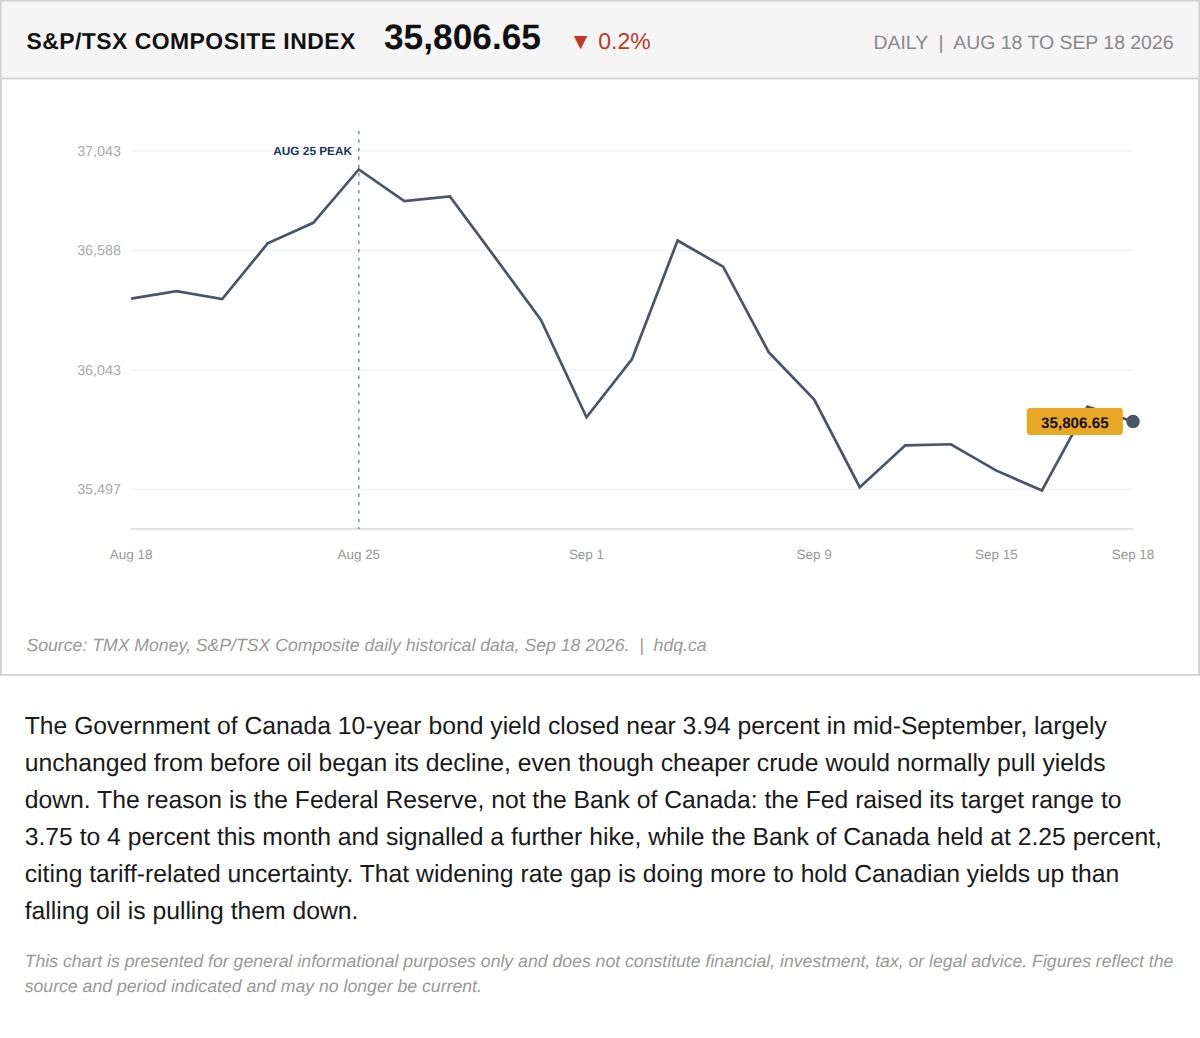
The Government of Canada 10-year bond yield closed near 3.94 percent in mid-September, largely unchanged from before oil began its decline,…
TSX Slides as Canadian Bond Yields Stay Elevated Despite Falling Oil
September 21, 2026
View chart & download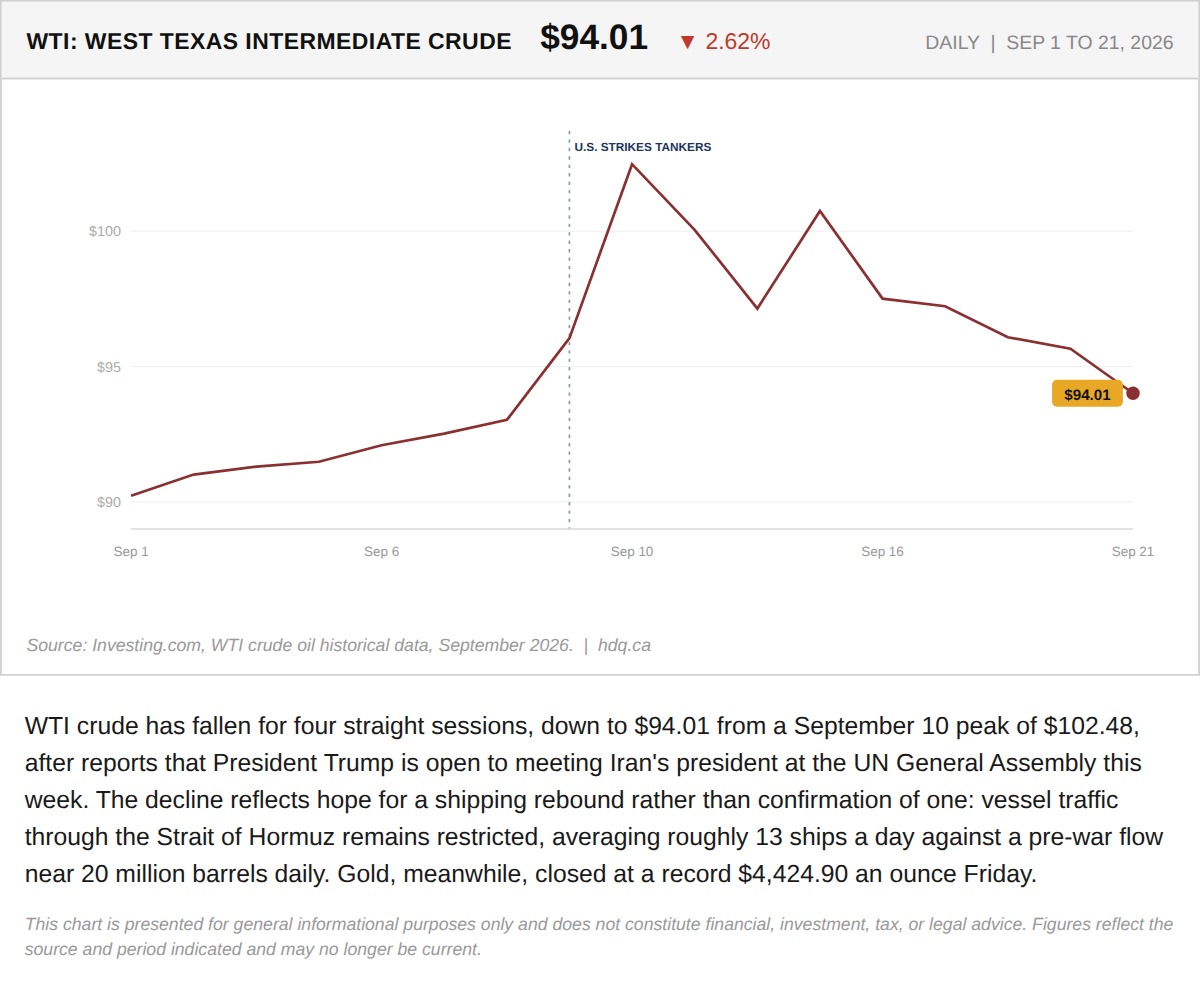
WTI crude has fallen for four straight sessions, down to $94.01 from a September 10 peak of $102.48, after reports that President Trump is…
The Strait of Hormuz Priced In a War. This Week It Started Pricing an Exit.
September 21, 2026
View chart & download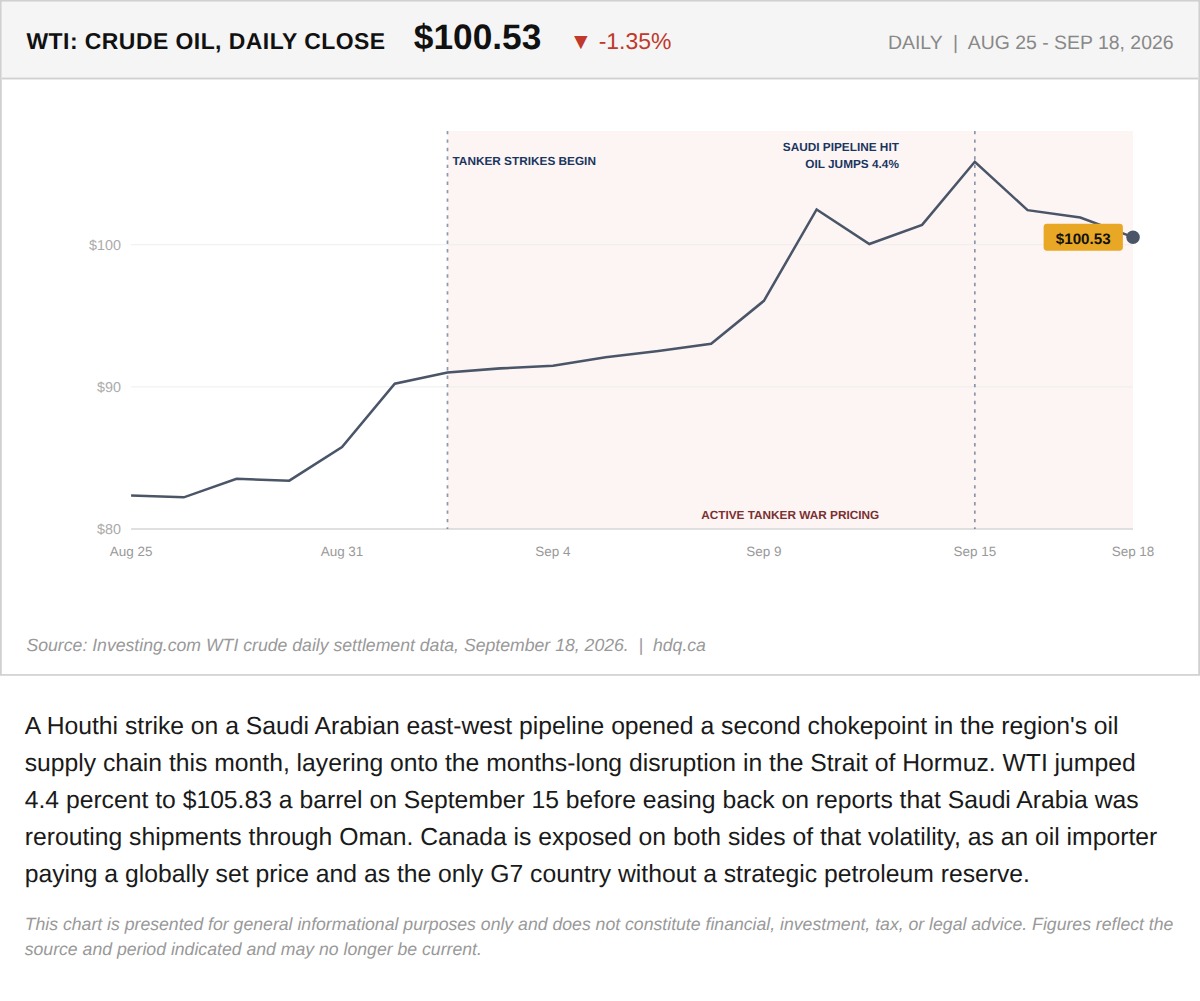
A Houthi strike on a Saudi Arabian east-west pipeline opened a second chokepoint in the region's oil supply chain this month, layering onto…
The Strait of Hormuz Story Just Got a Second Chokepoint, and Canada Has Exposure on Both Sides
September 18, 2026
View chart & download