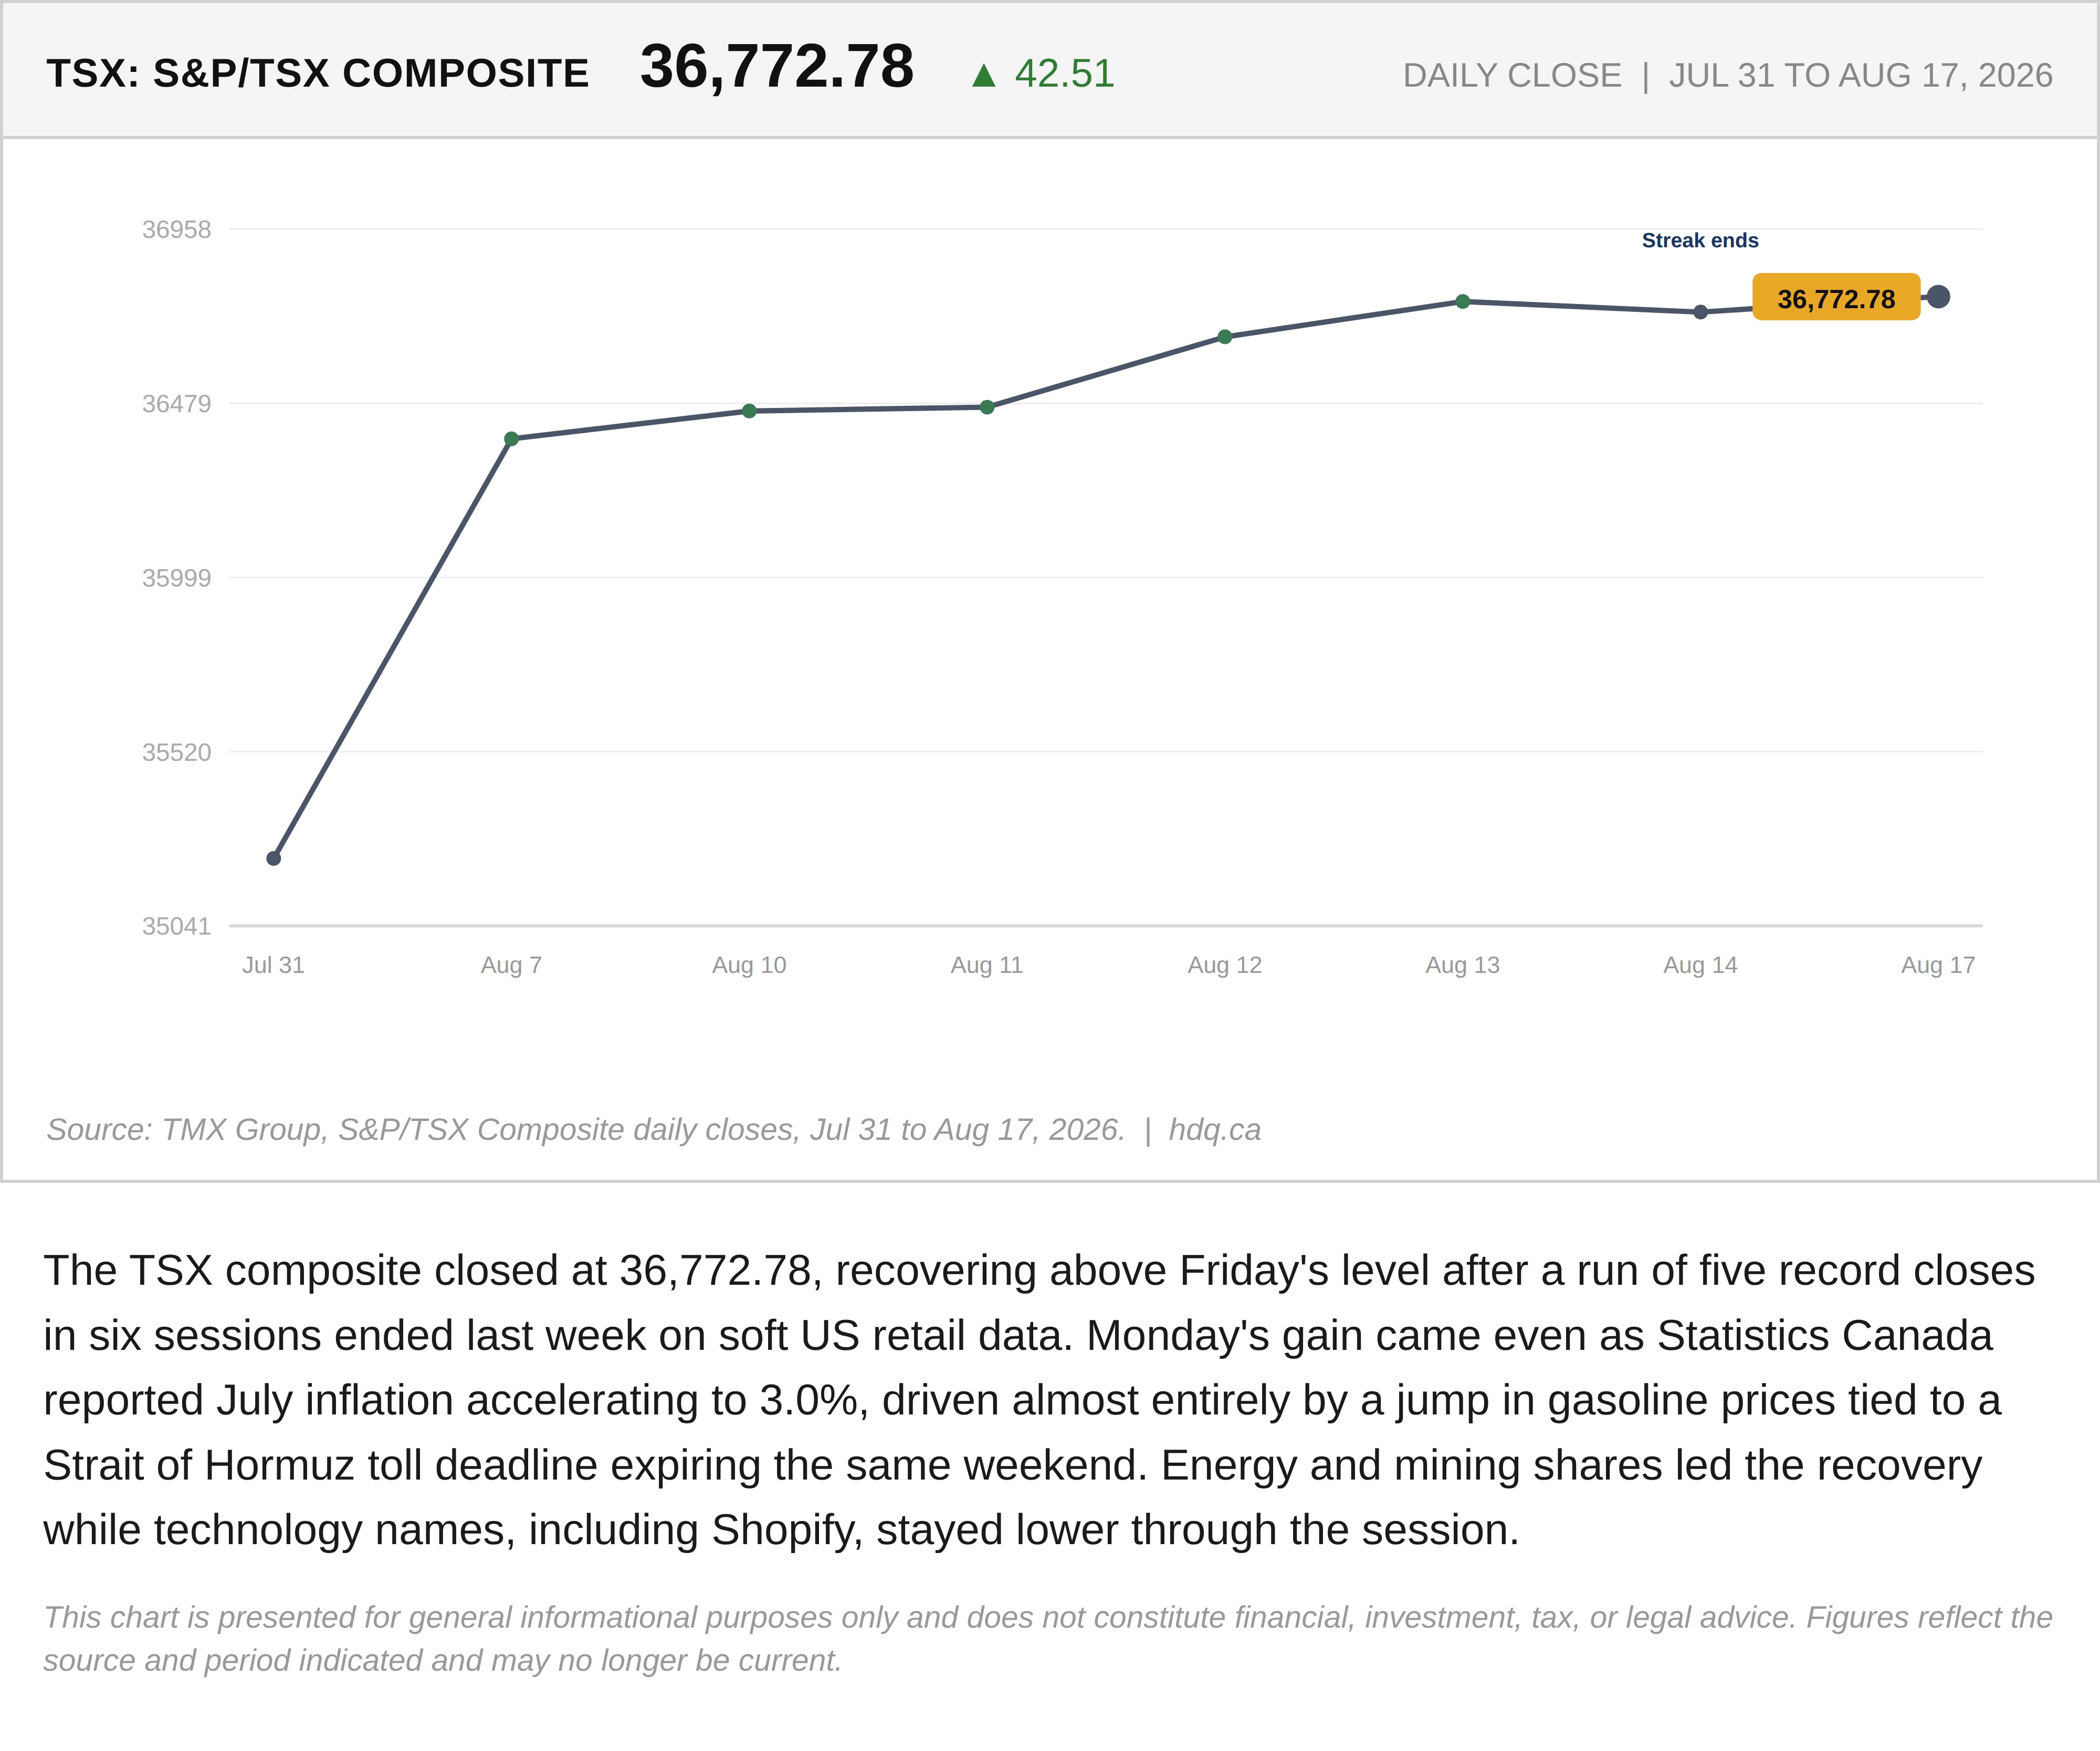
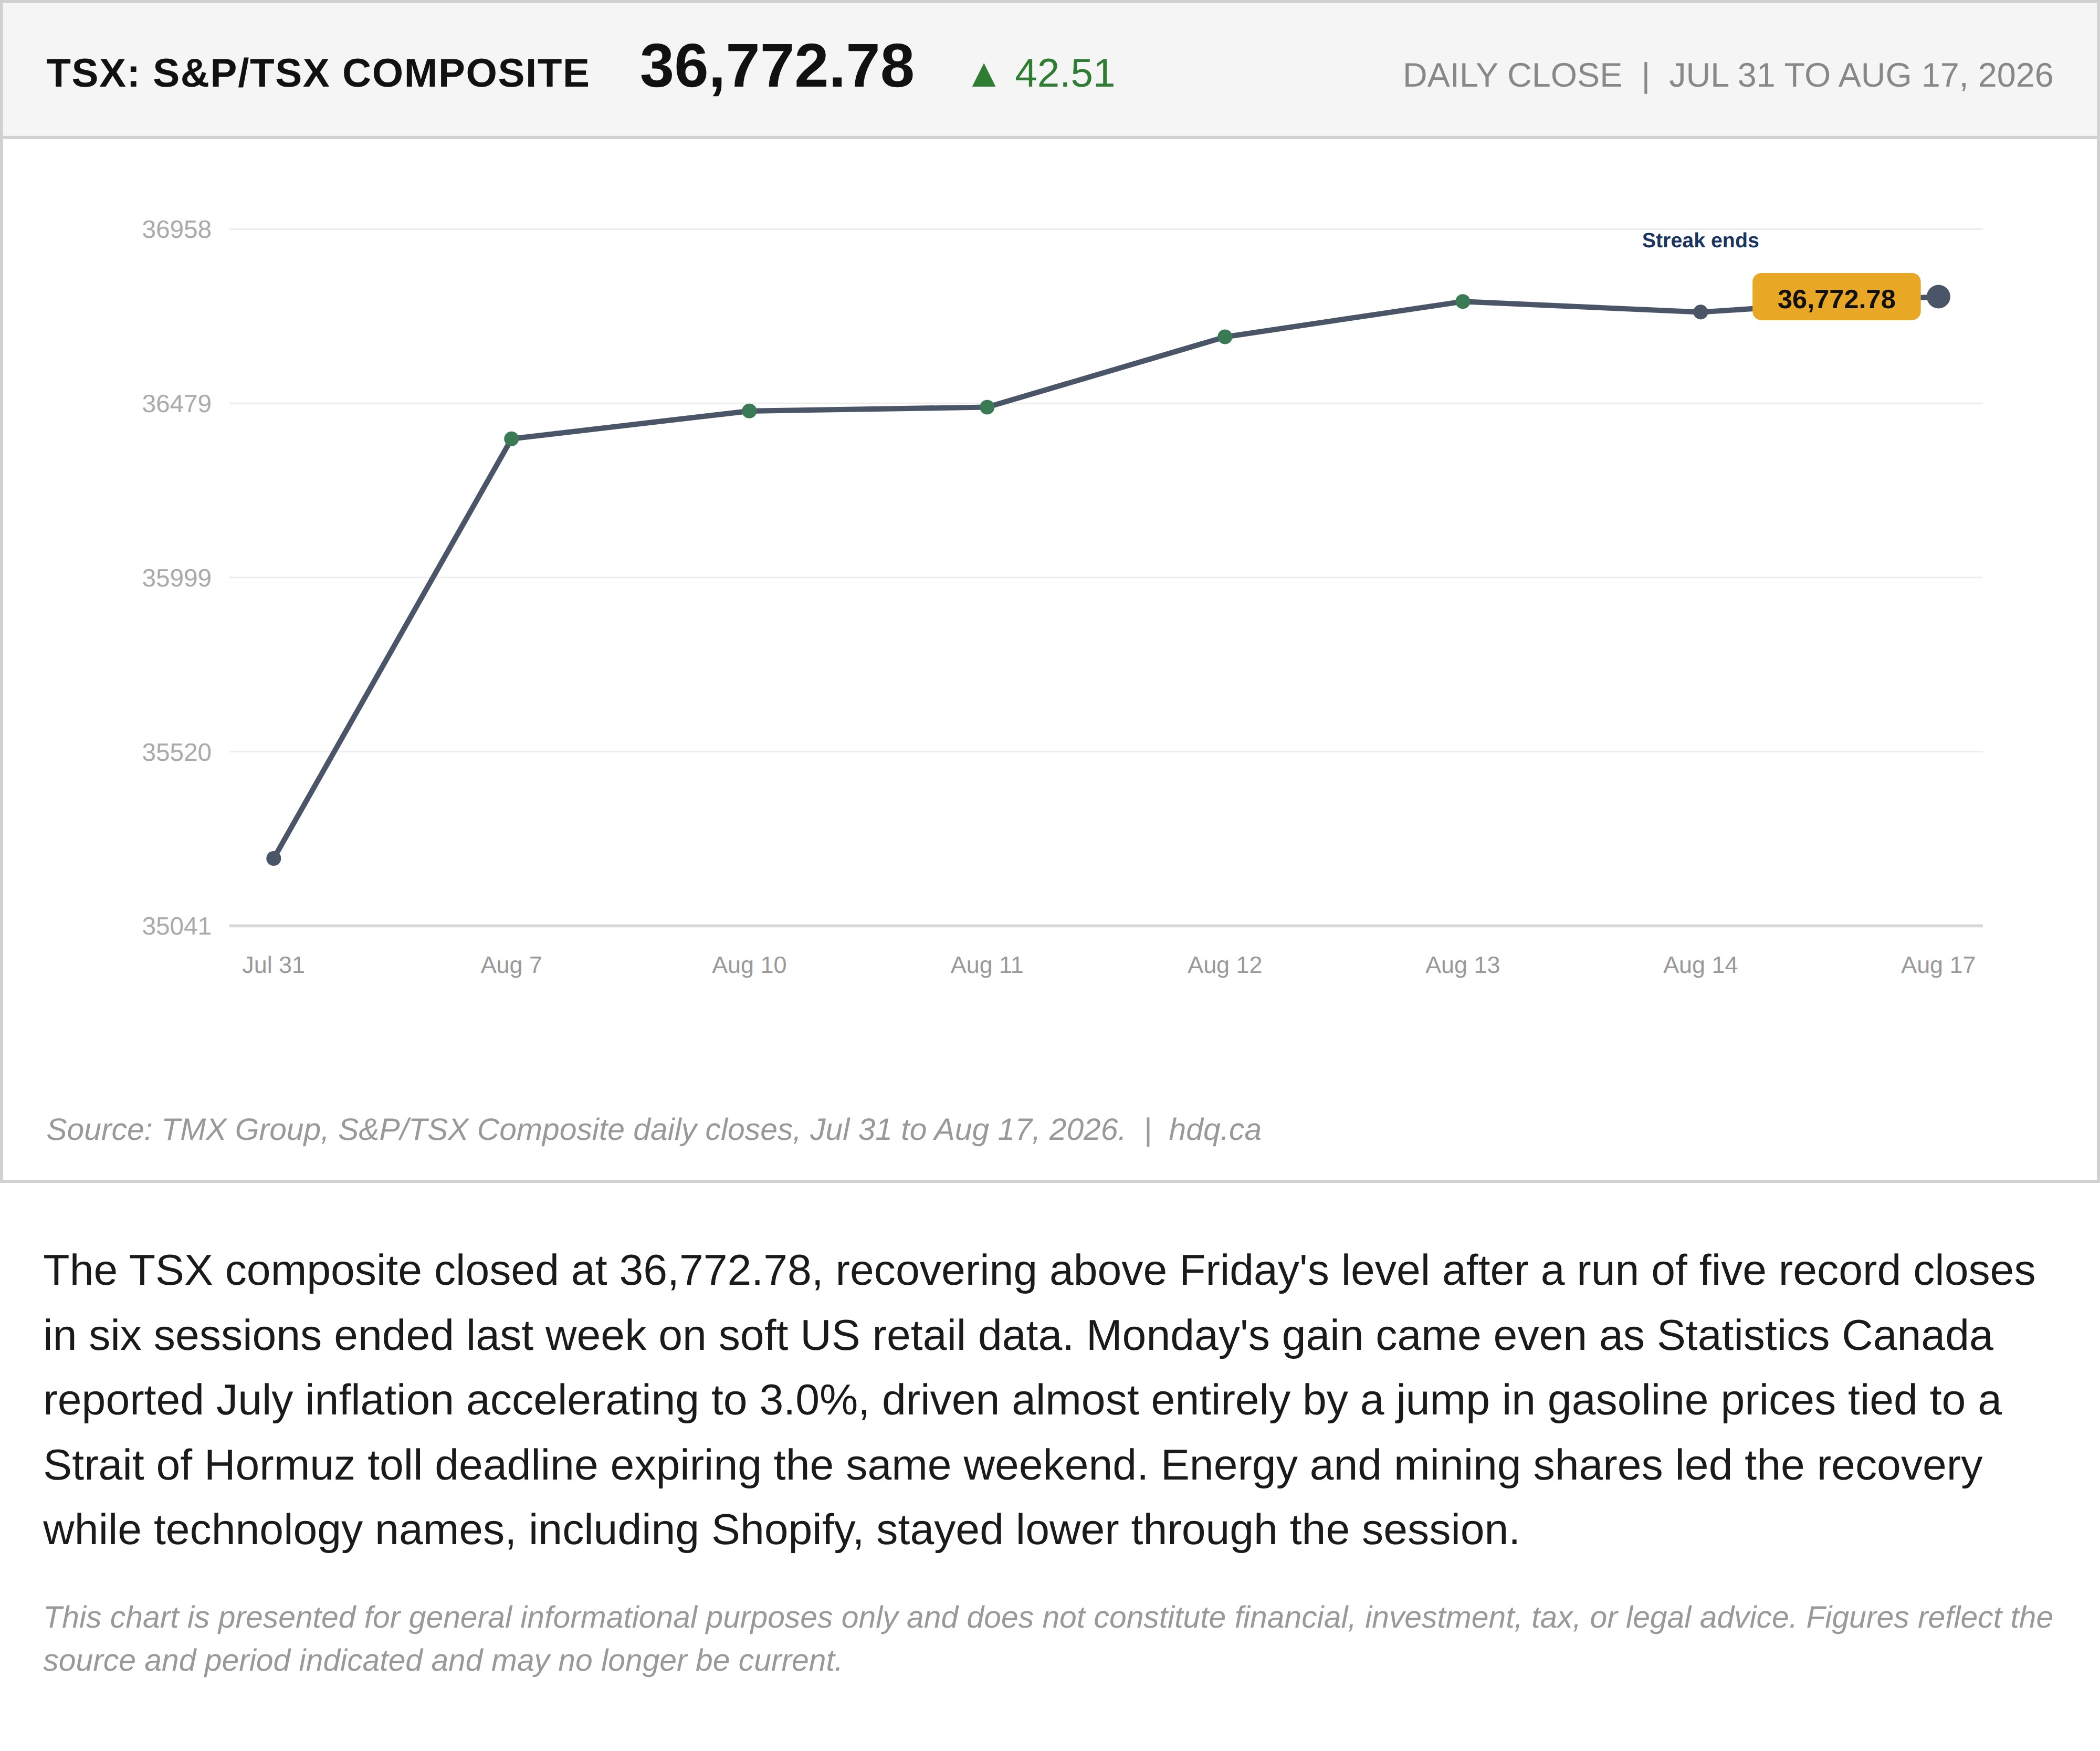
The TSX composite closed at 36,772.78, recovering above Friday's level after a run of five record closes in six sessions ended last week on soft US retail data. Monday's gain came even as Statistics Canada reported July inflation accelerating to 3.0%, driven almost entirely by a jump in gasoline prices tied to a Strait of Hormuz toll deadline expiring the same weekend. Energy and mining shares led the recovery while technology names, including Shopify, stayed lower through the session.
This chart is presented for general informational purposes only and does not constitute financial, investment, tax, or legal advice. Figures reflect the source and period indicated and may no longer be current.
Related charts
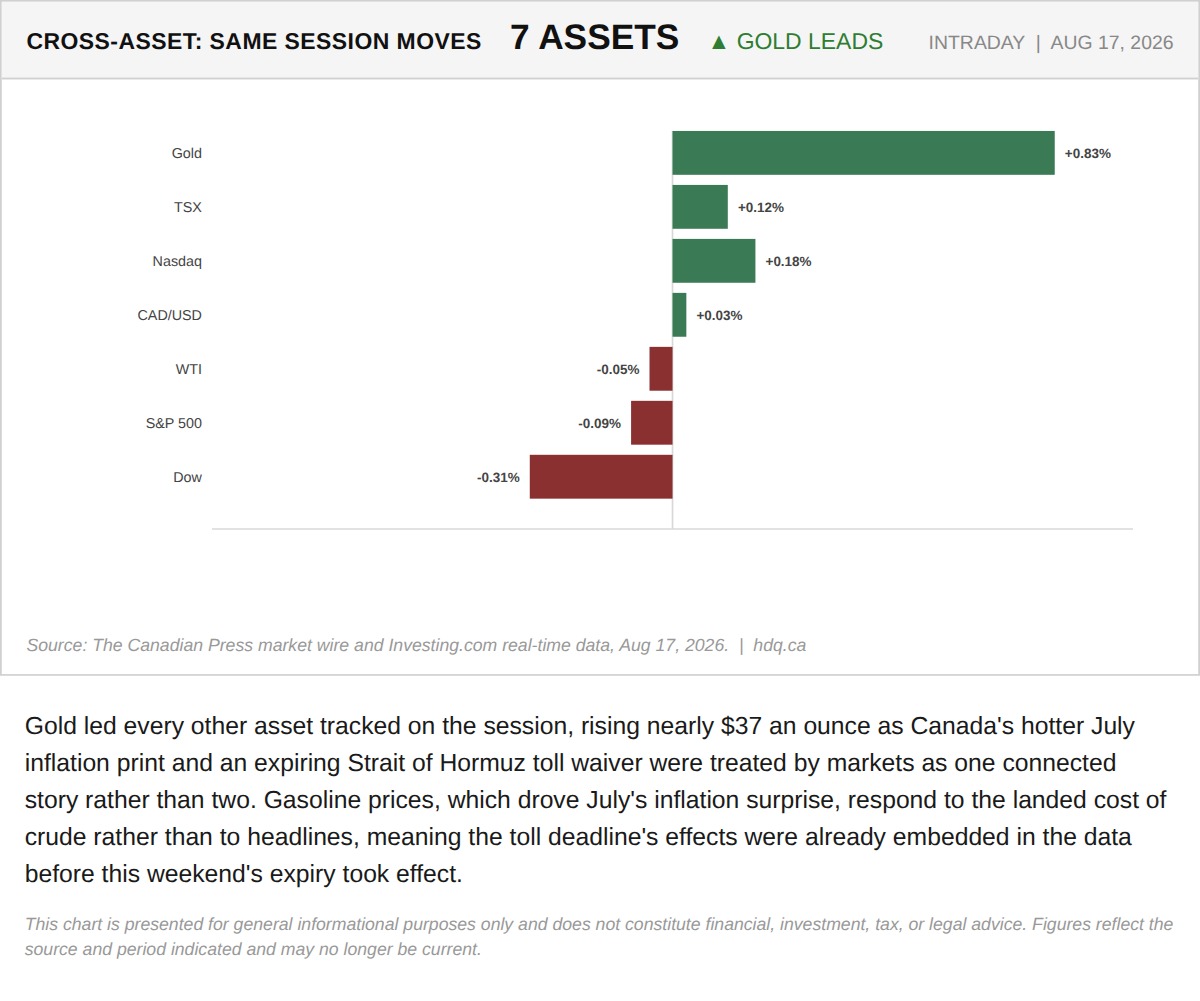
Gold led every other asset tracked on the session, rising nearly $37 an ounce as Canada's hotter July inflation print and an expiring…
This Morning's CPI Beat Already Contains the Hormuz Toll Nobody Has Priced Yet
August 17, 2026
View chart & download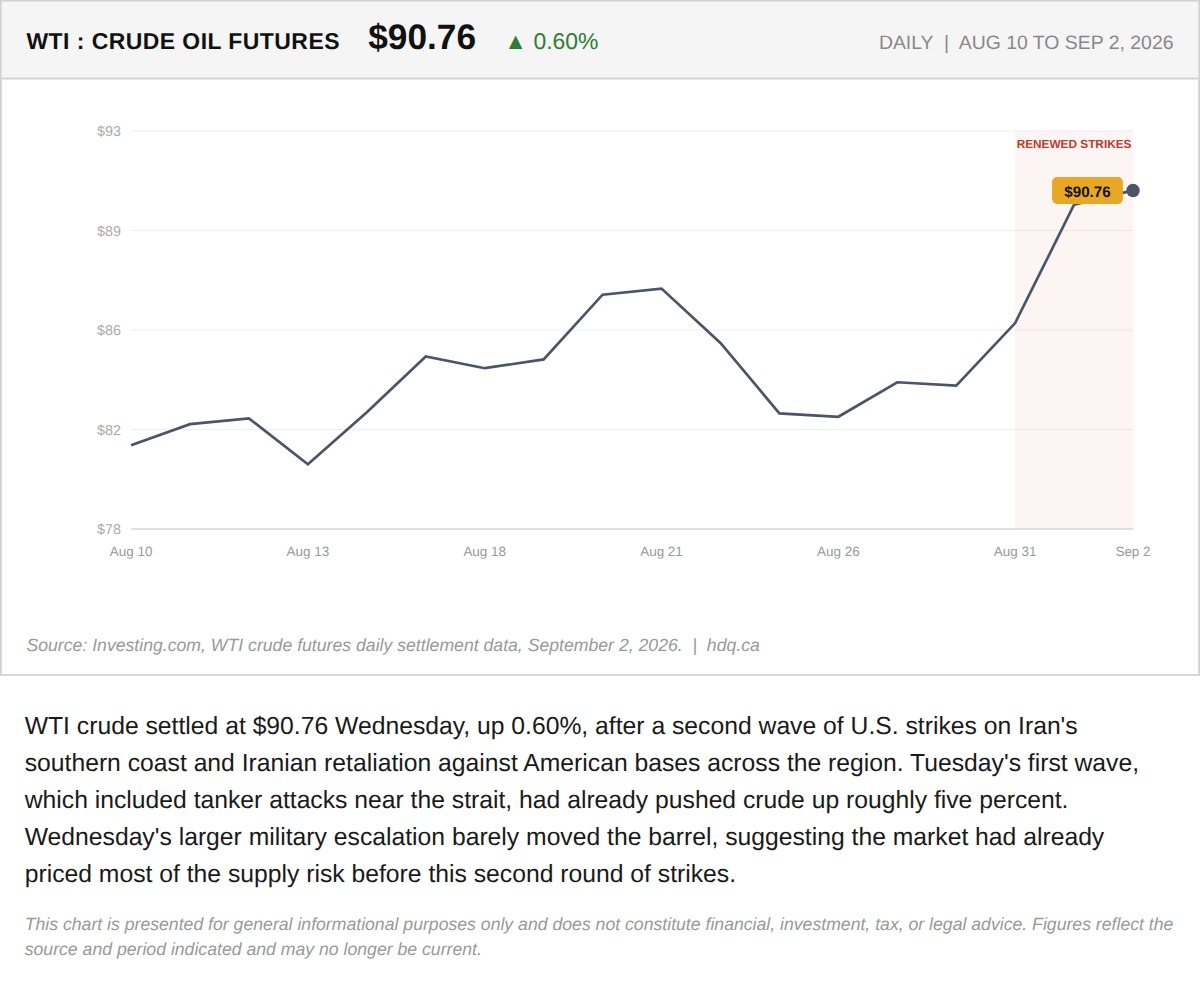
WTI crude settled at $90.76 Wednesday, up 0.60%, after a second wave of U.S.
WTI Crude Adds 0.60% as a Second Wave of Strikes Near Iran Barely Moves the Barrel
September 2, 2026
View chart & download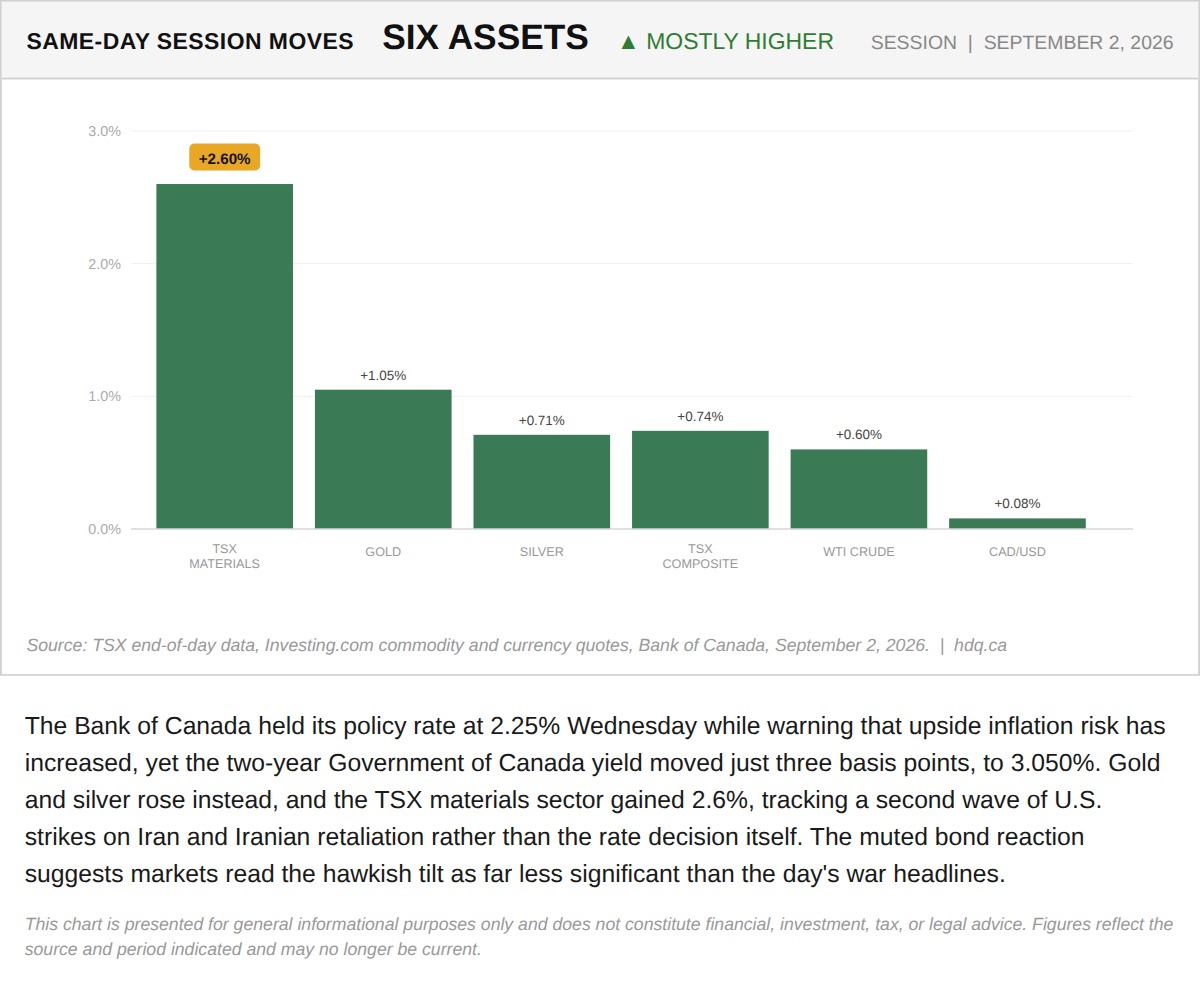
The Bank of Canada held its policy rate at 2.25% Wednesday while warning that upside inflation risk has increased, yet the two-year…
TSX Materials, Gold and Silver Lead a Broad Same-Day Rally Across Six Assets
September 2, 2026
View chart & download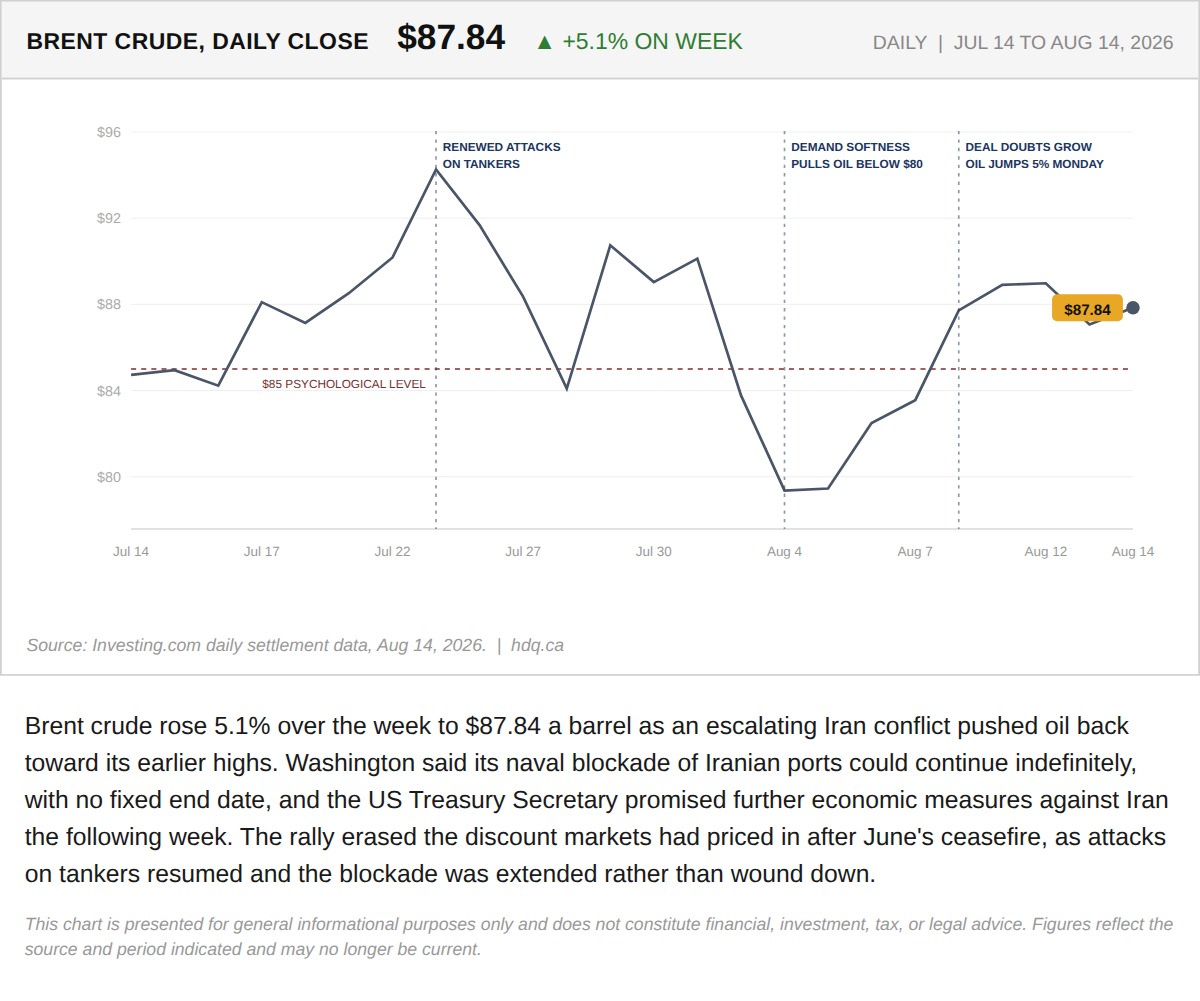
Brent crude rose 5.1% over the week to $87.84 a barrel as an escalating Iran conflict pushed oil back toward its earlier highs.
The TSX and Gold Both Set Records This Week. That Should Not Happen Together.
August 15, 2026
View chart & download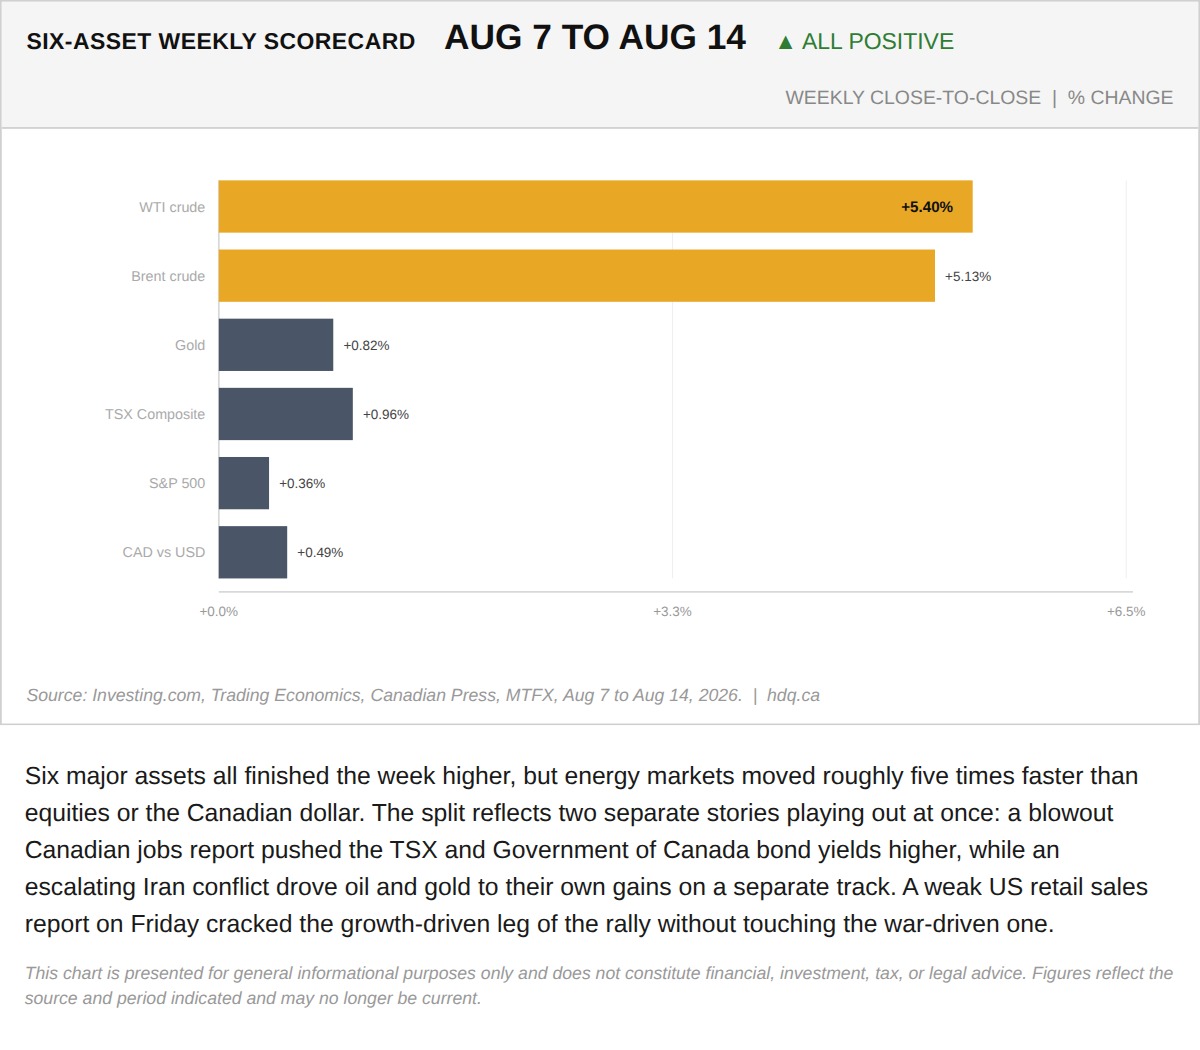
Six major assets all finished the week higher, but energy markets moved roughly five times faster than equities or the Canadian dollar.
The TSX and Gold Both Set Records This Week. That Should Not Happen Together.
August 15, 2026
View chart & download
The S&P/TSX Composite closed July at 35,226, up 1.06% for the month, a modest headline figure that conceals sharp intra-month swings.
S&P/TSX Composite closes July up 1.06% after a volatile month
July 31, 2026
View chart & download