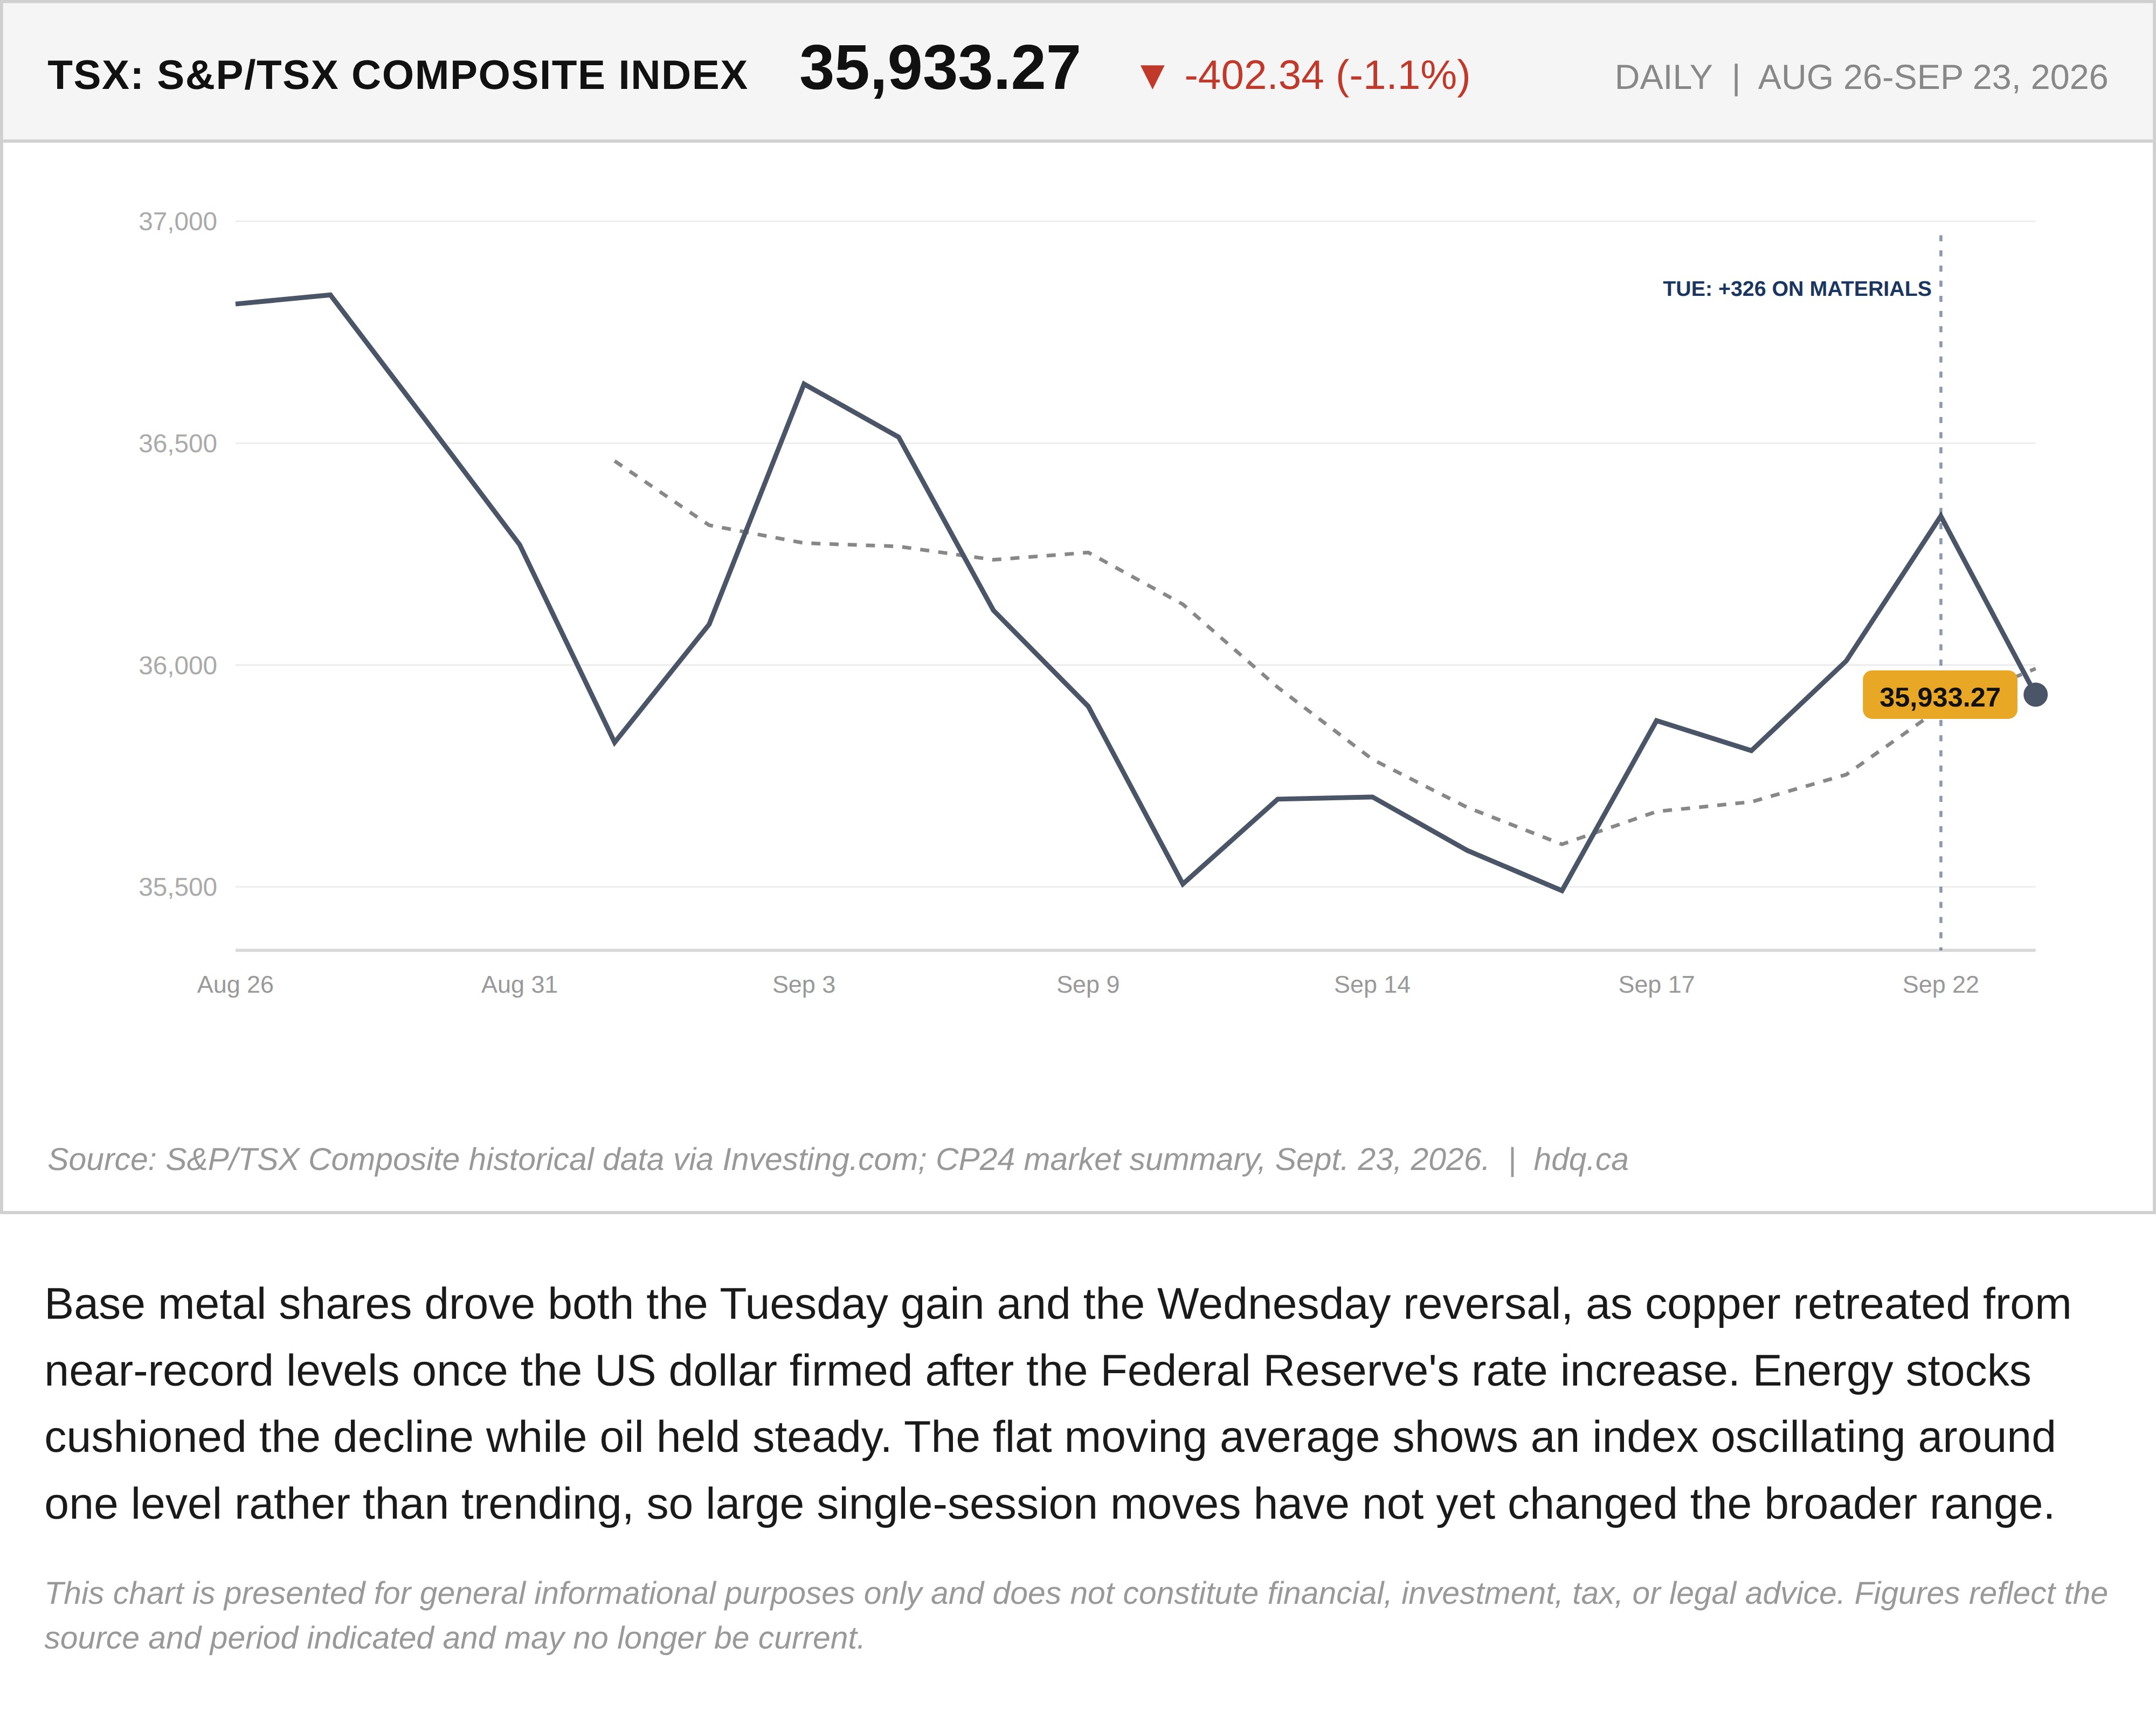
Base metal shares drove both the Tuesday gain and the Wednesday reversal, as copper retreated from near-record levels once the US dollar firmed after the Federal Reserve's rate increase. Energy stocks cushioned the decline while oil held steady. The flat moving average shows an index oscillating around one level rather than trending, so large single-session moves have not yet changed the broader range.
This chart is presented for general informational purposes only and does not constitute financial, investment, tax, or legal advice. Figures reflect the source and period indicated and may no longer be current.
Related charts
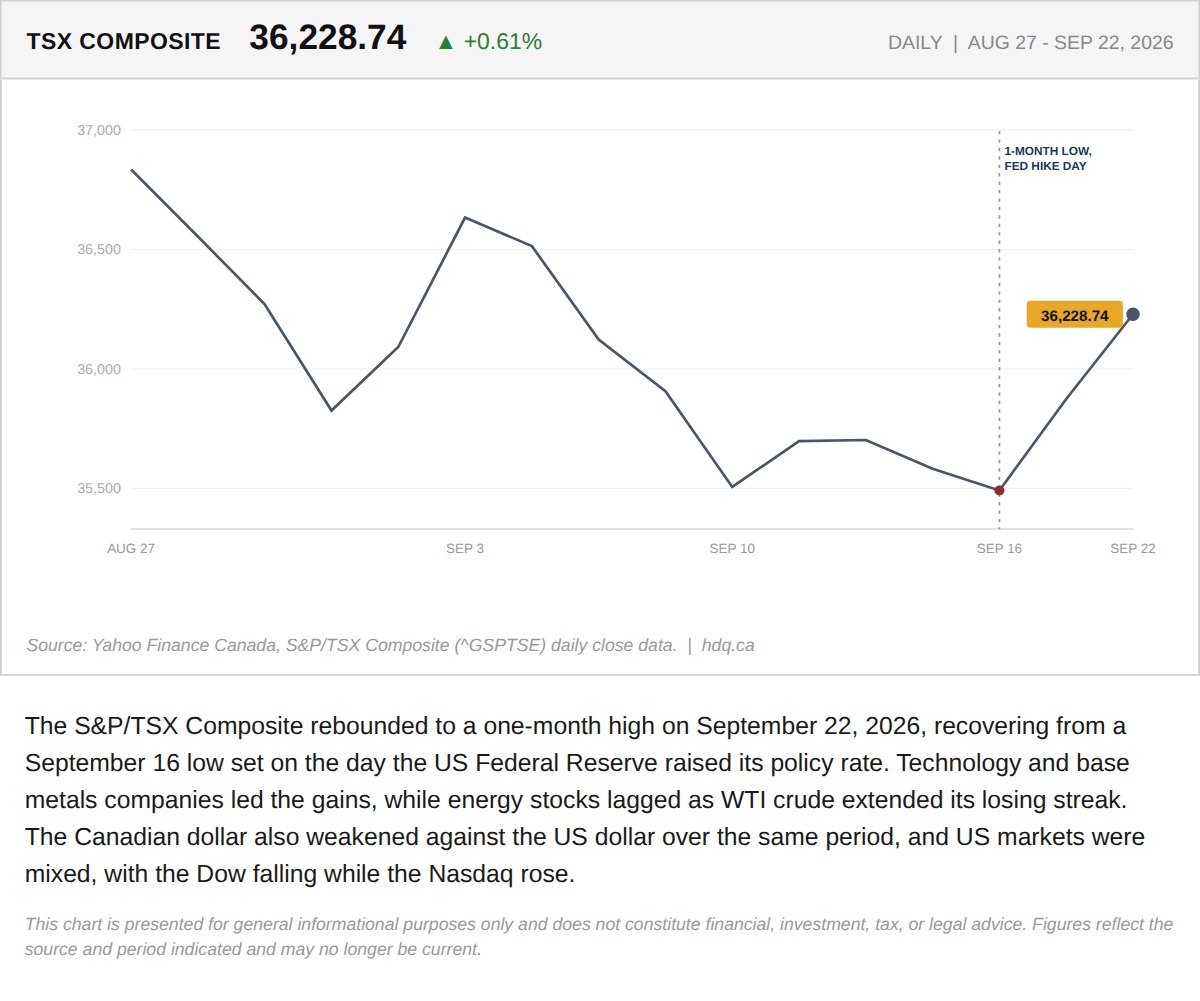
The S&P/TSX Composite rebounded to a one-month high on September 22, 2026, recovering from a September 16 low set on the day the US Federal Reserve raised its policy rate.
The TSX Hit a One-Month High on Tech and Base Metals While Energy Keeps Falling
September 23, 2026
View chart & download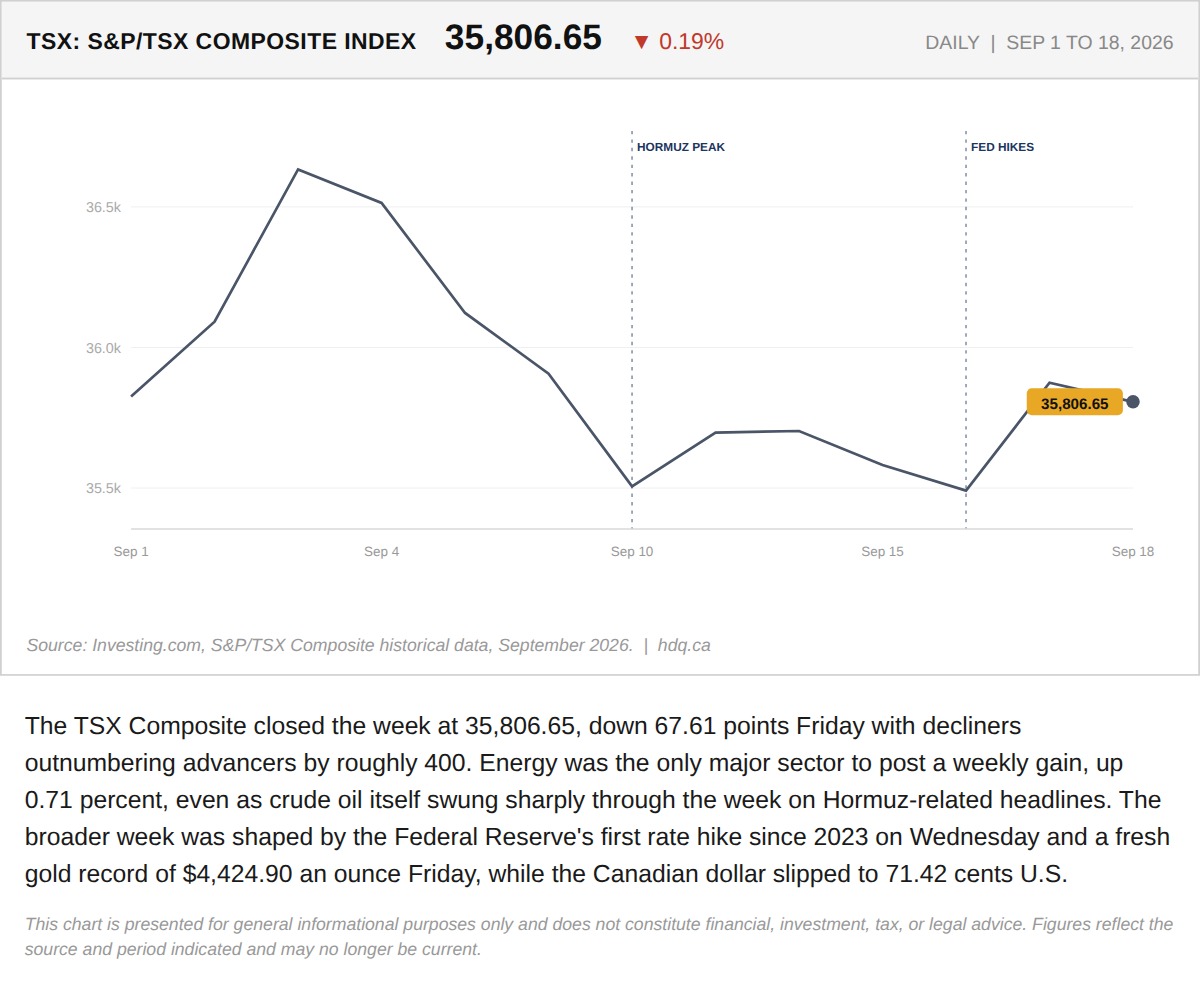
The TSX Composite closed the week at 35,806.65, down 67.61 points Friday with decliners outnumbering advancers by roughly 400.
The TSX Closed a Volatile Week at 35,806.65. Energy Was the Only Sector That Actually Held.
September 21, 2026
View chart & download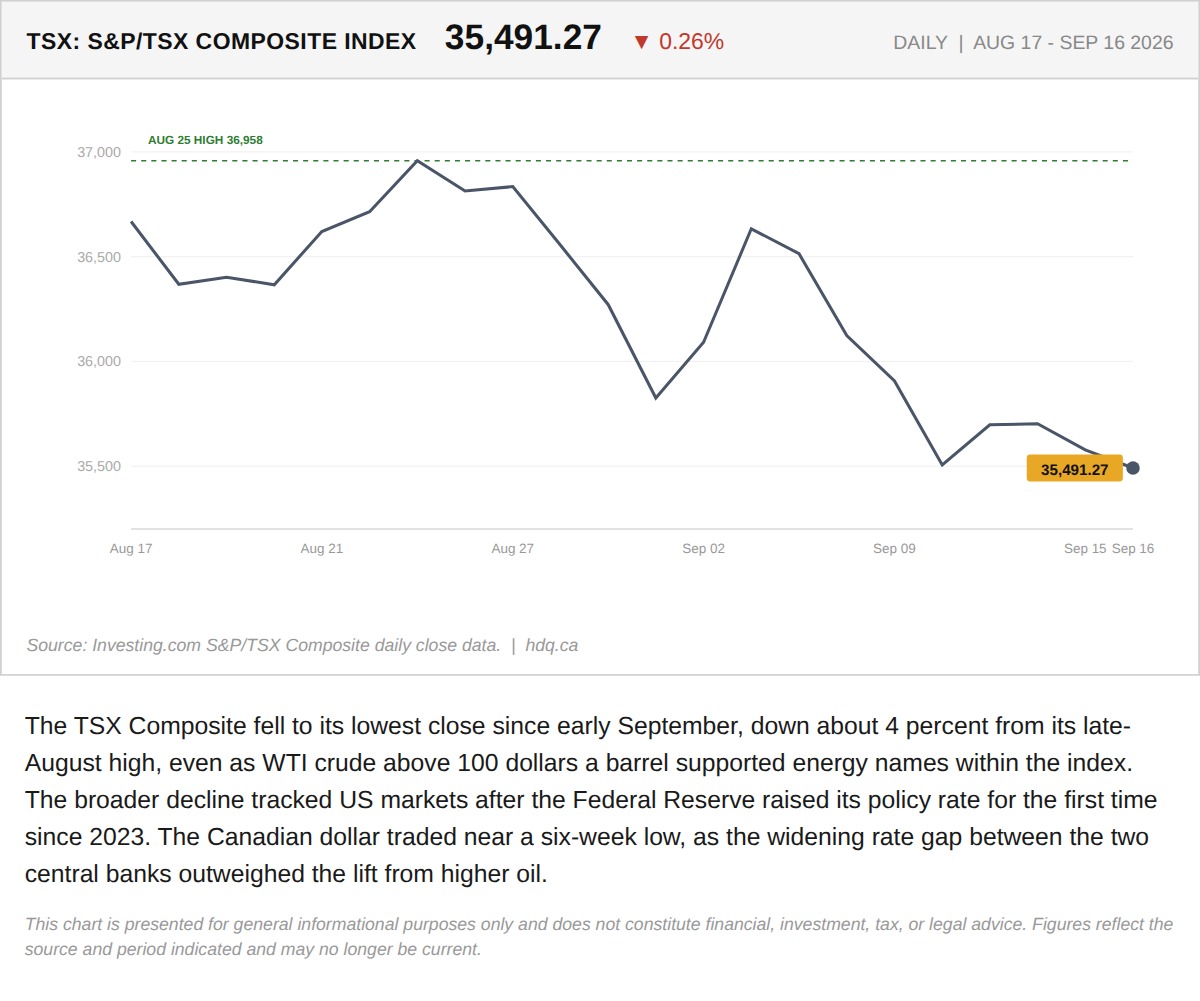
The TSX Composite fell to its lowest close since early September, down about 4 percent from its late-August high, even as WTI crude above…
The TSX Fell 91 Points as the Fed Decision Overpowered Rising Oil
September 17, 2026
View chart & download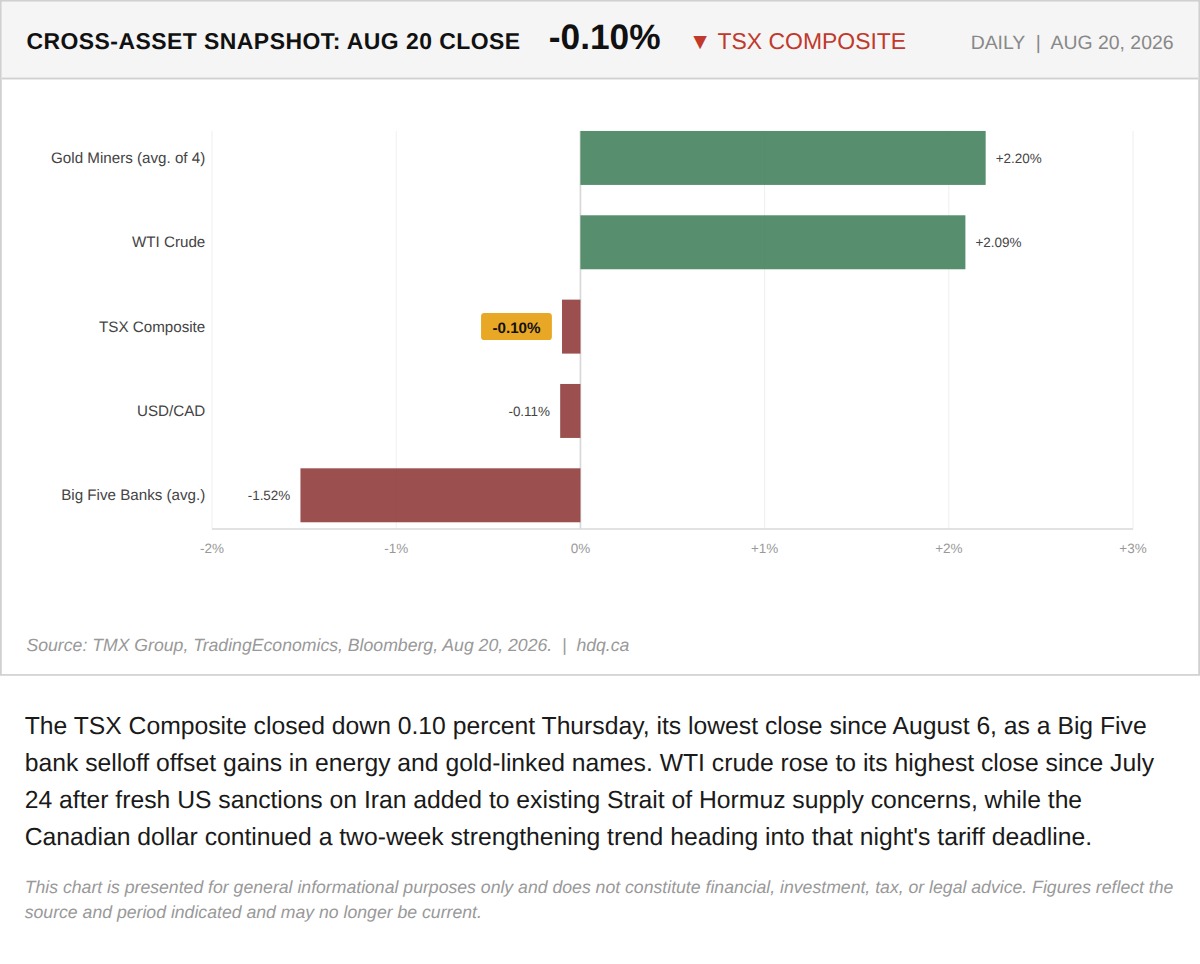
The TSX Composite closed down 0.10 percent Thursday, its lowest close since August 6, as a Big Five bank selloff offset gains in energy and gold-linked names.
TSX Closes Flat as Bank Selloff Offsets Energy and Gold Gains
August 21, 2026
View chart & download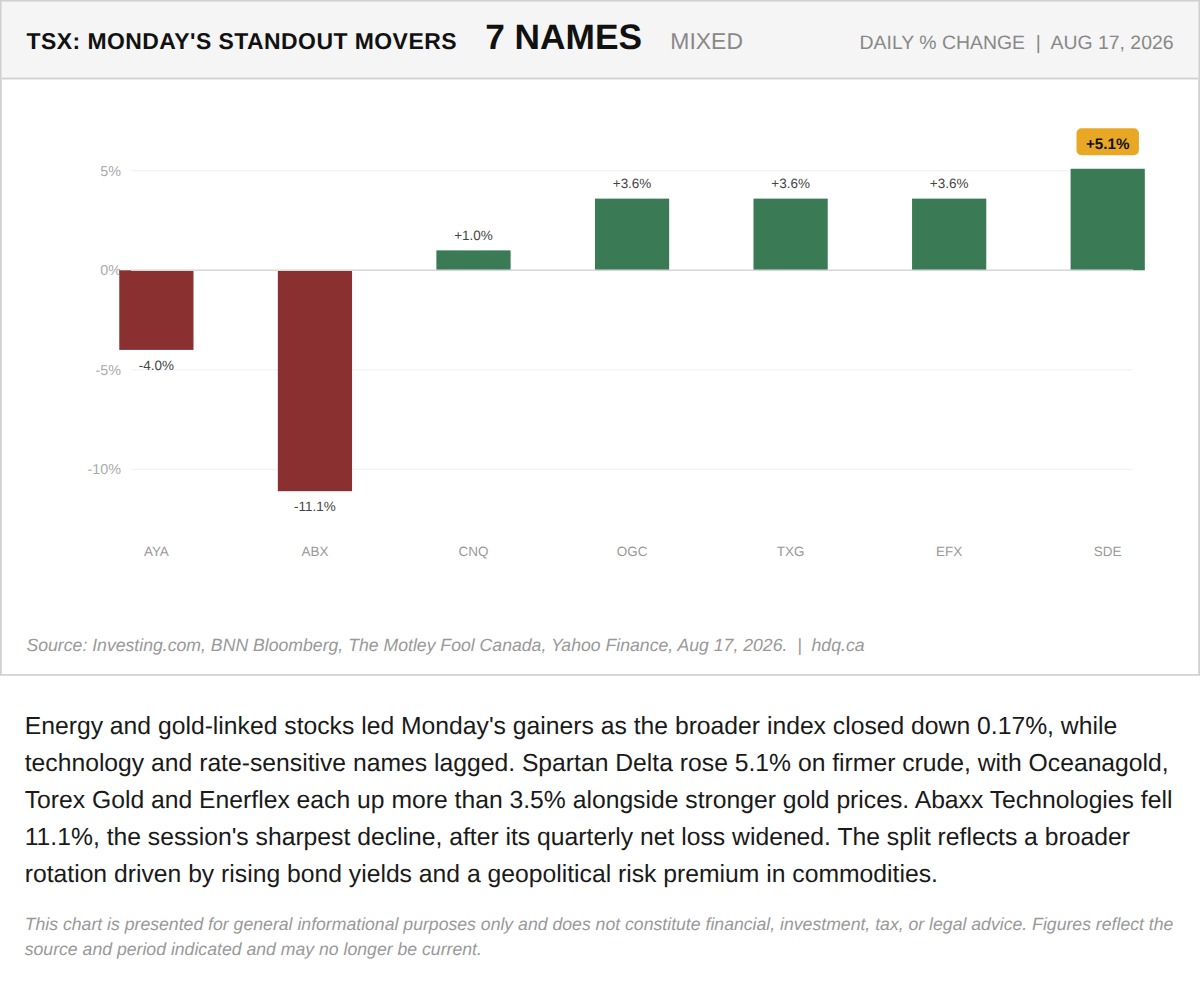
Energy and gold-linked stocks led Monday's gainers as the broader index closed down 0.17%, while technology and rate-sensitive names lagged.
Energy and Gold Names Lead Monday's TSX Movers
August 18, 2026
View chart & download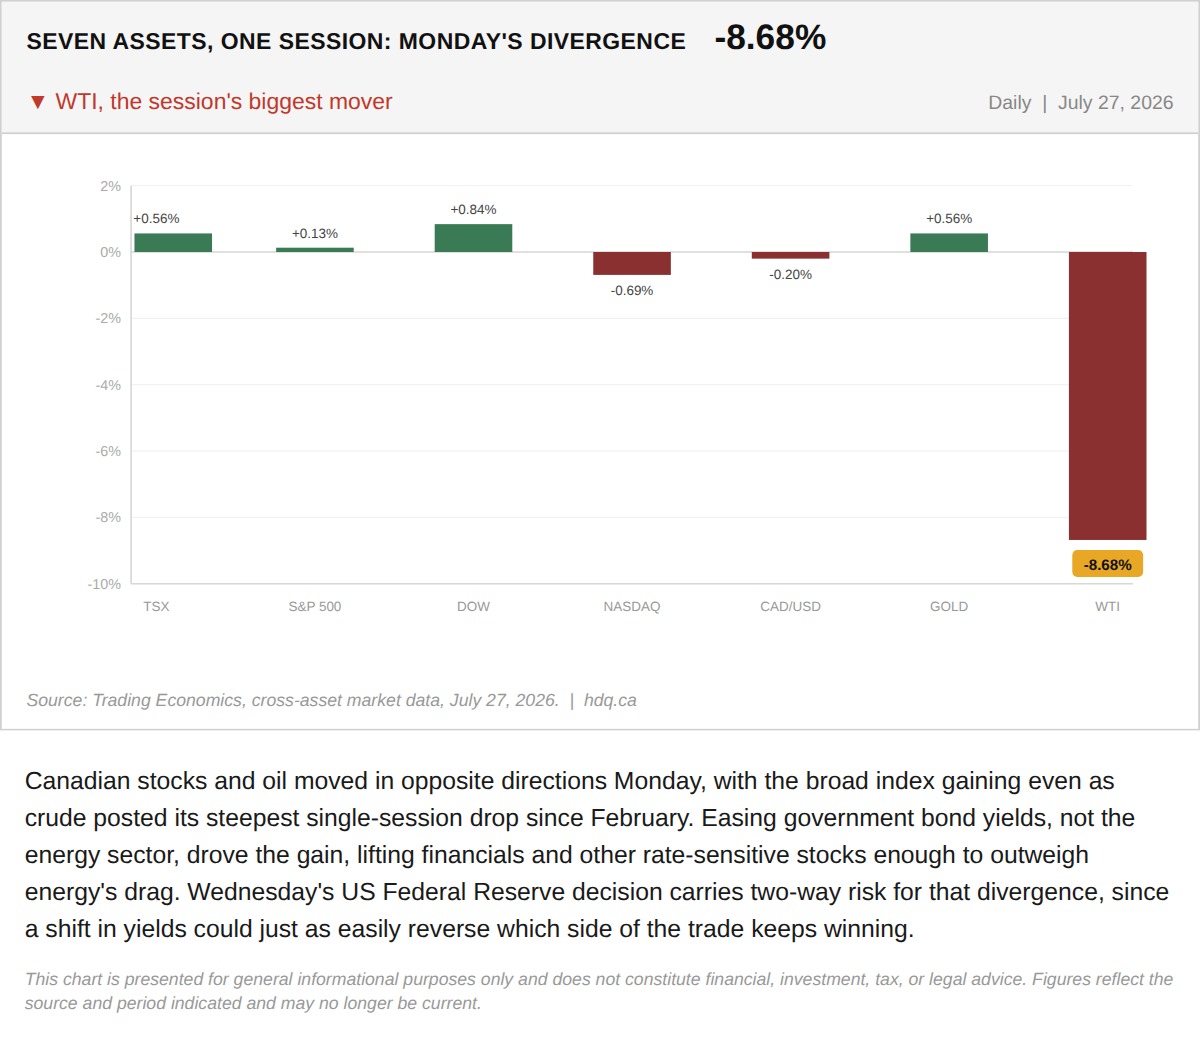
Canadian stocks and oil moved in opposite directions Monday, with the broad index gaining even as crude posted its steepest single-session drop since February.
The TSX Gained 0.56% Monday While Oil Fell 8.7%. That Divergence Is the Trade.
July 28, 2026
View chart & download