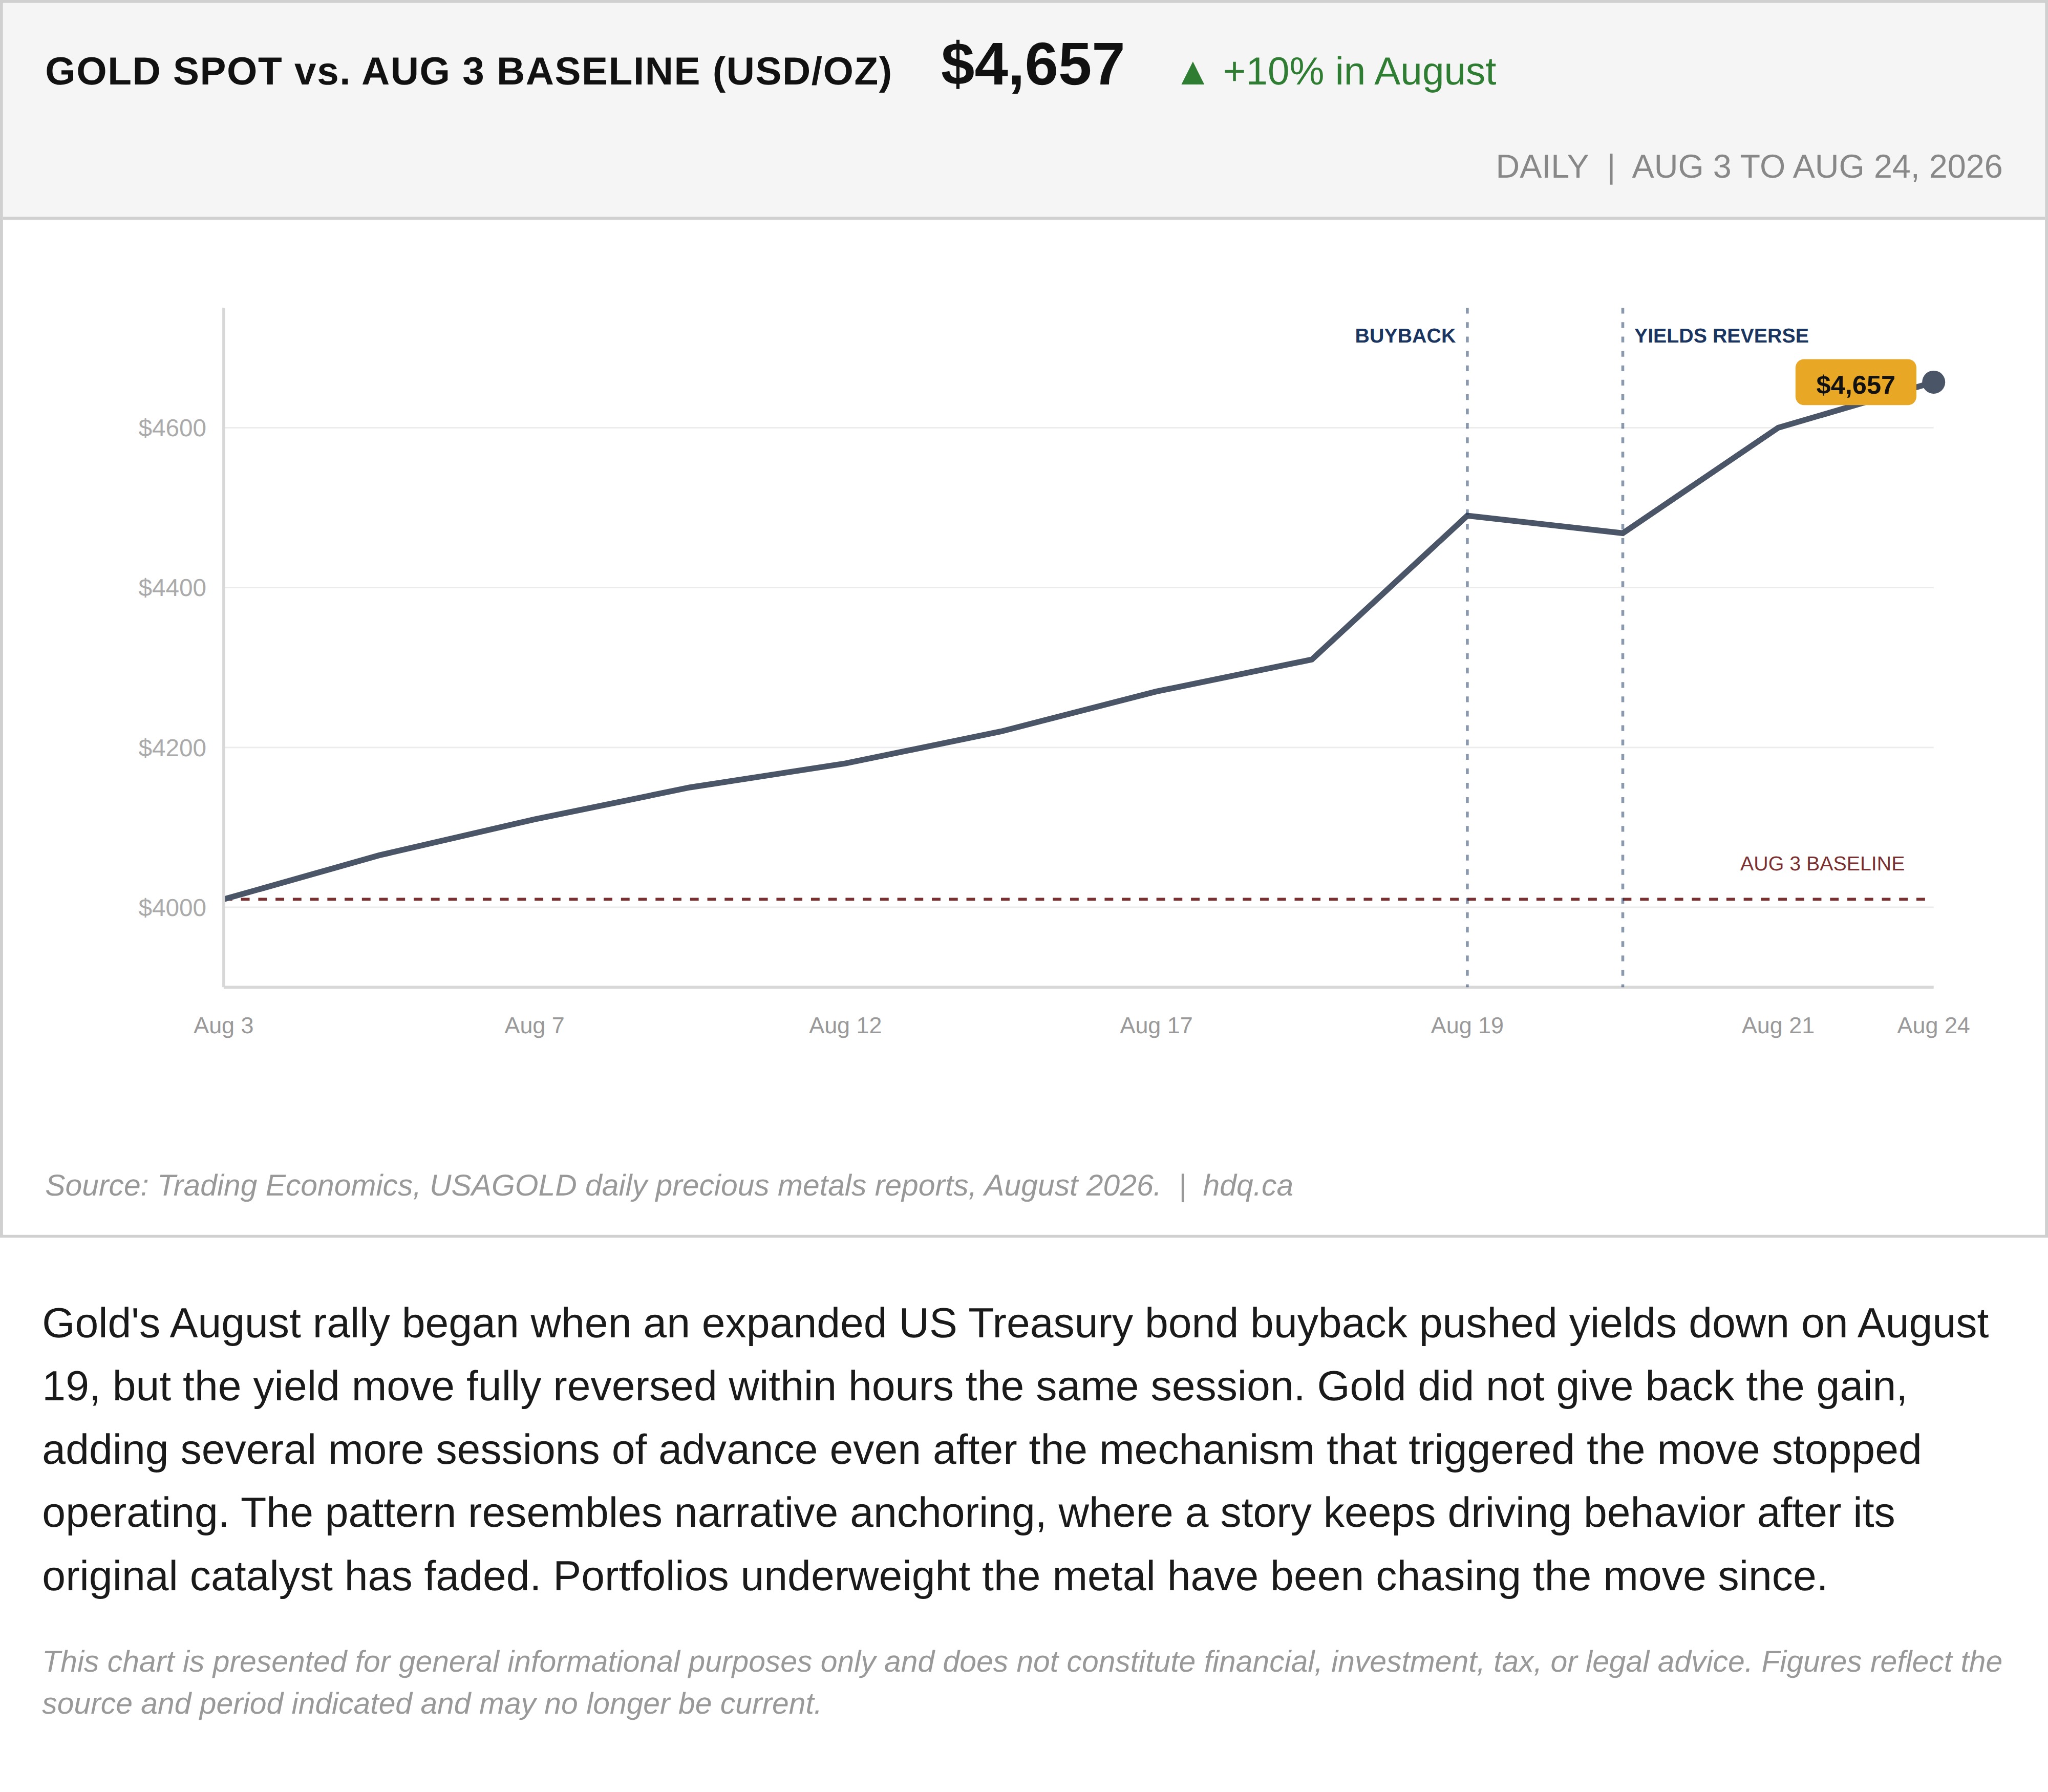
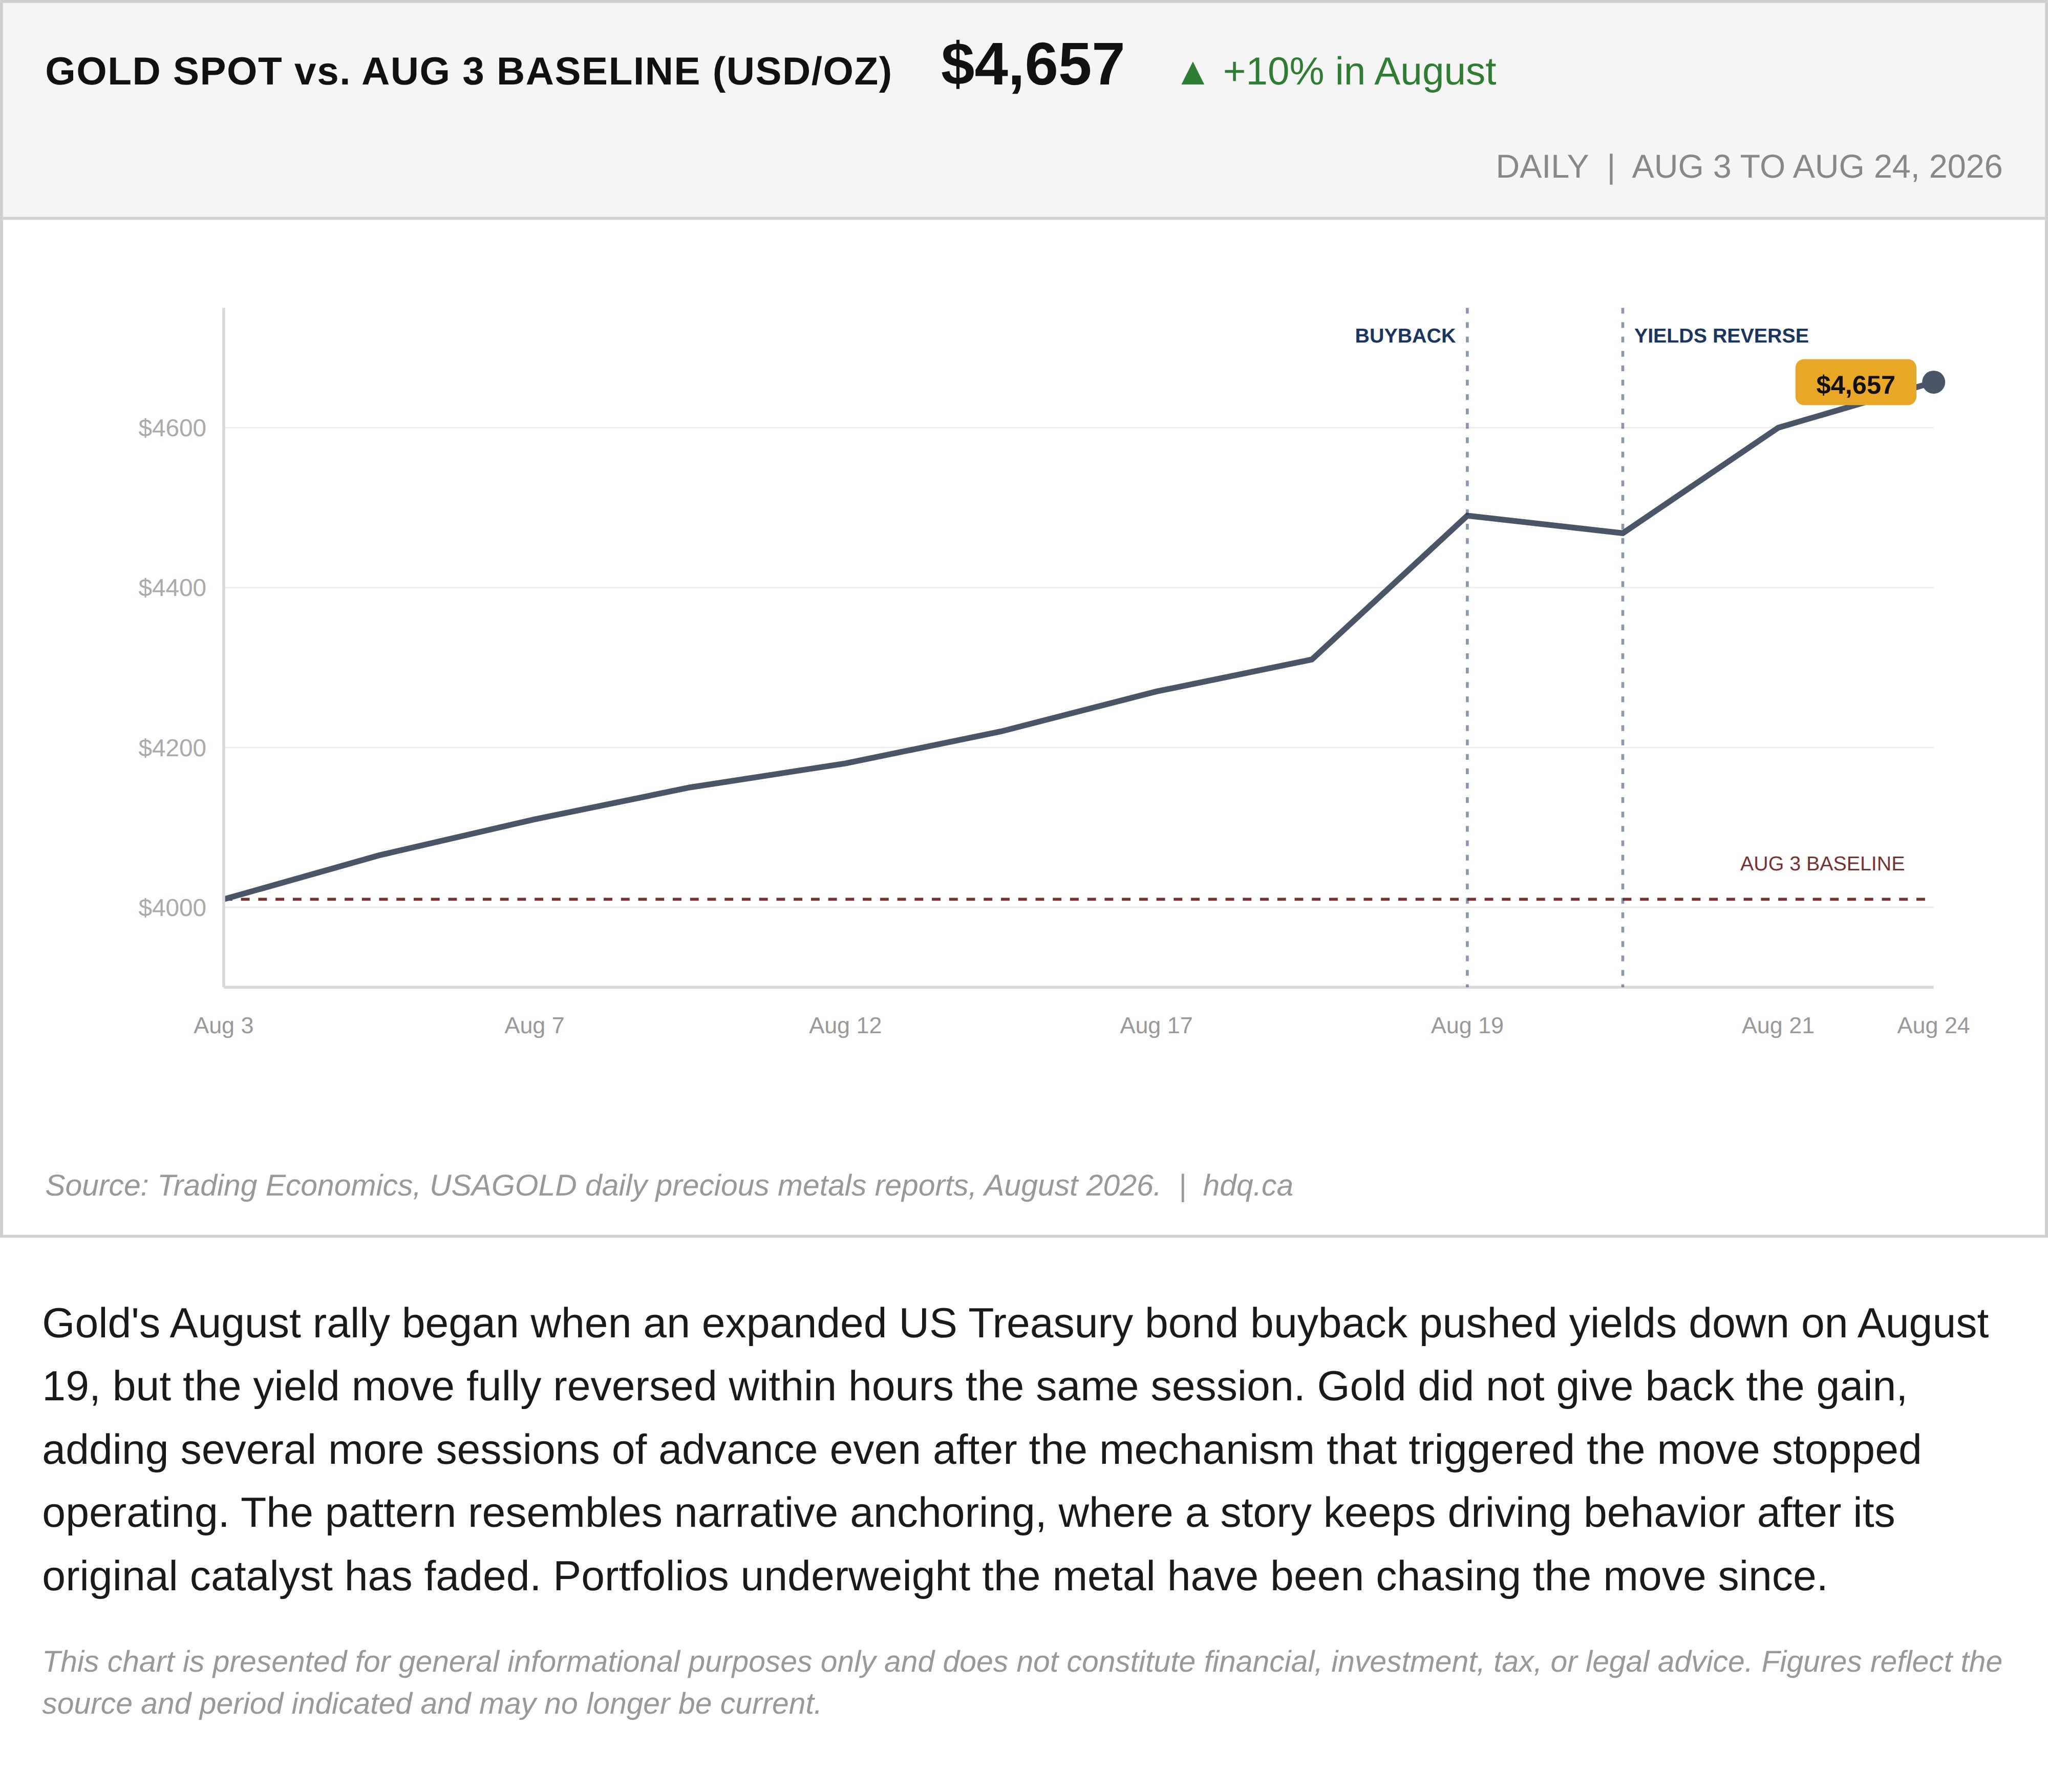
Gold's August rally began when an expanded US Treasury bond buyback pushed yields down on August 19, but the yield move fully reversed within hours the same session. Gold did not give back the gain, adding several more sessions of advance even after the mechanism that triggered the move stopped operating. The pattern resembles narrative anchoring, where a story keeps driving behavior after its original catalyst has faded. Portfolios underweight the metal have been chasing the move since.
This chart is presented for general informational purposes only and does not constitute financial, investment, tax, or legal advice. Figures reflect the source and period indicated and may no longer be current.
Related charts
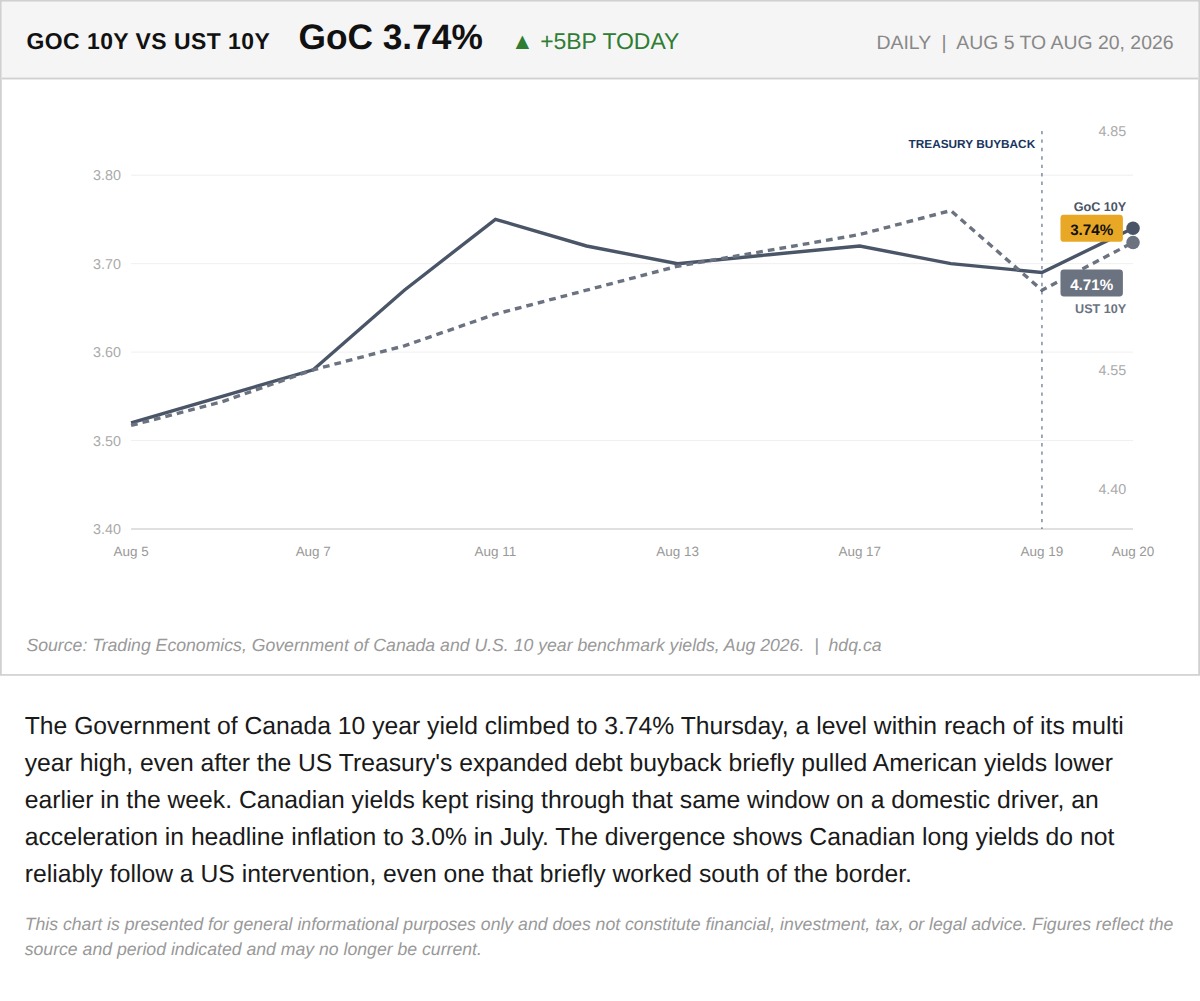
The Government of Canada 10 year yield climbed to 3.74% Thursday, a level within reach of its multi year high, even after the US Treasury's…
The Treasury Bond Rescue Reversed by Thursday, and Canada Never Got the Relief in the First Place
August 20, 2026
View chart & download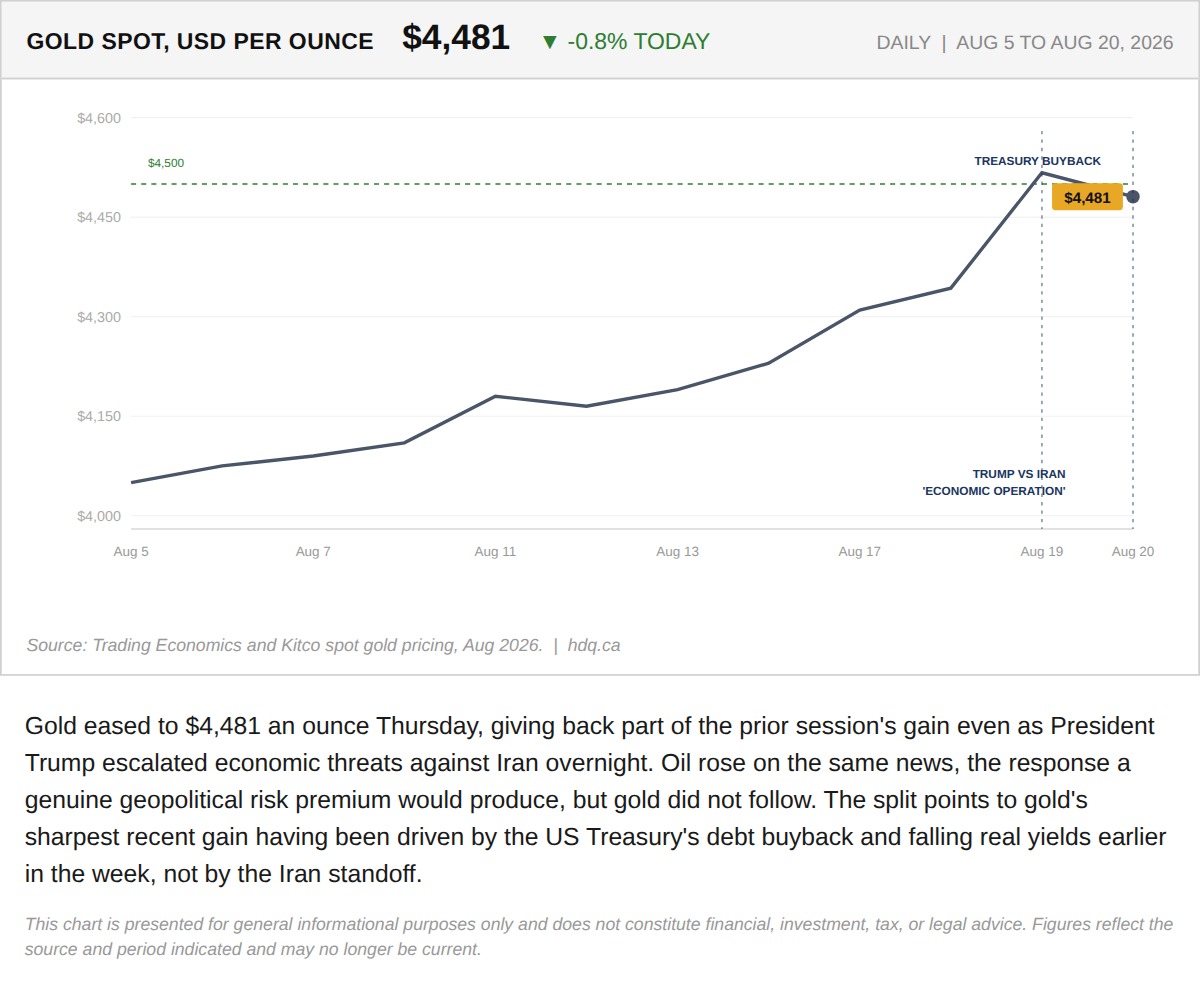
Gold eased to $4,481 an ounce Thursday, giving back part of the prior session's gain even as President Trump escalated economic threats against Iran overnight.
The Treasury Bond Rescue Reversed by Thursday, and Canada Never Got the Relief in the First Place
August 20, 2026
View chart & download
The S&P/TSX Composite closed July at 35,226, up 1.06% for the month, a modest headline figure that conceals sharp intra-month swings.
S&P/TSX Composite closes July up 1.06% after a volatile month
July 31, 2026
View chart & download
Brent and WTI crude both surged in July, with WTI ending the month at $85.47, up 23.0%, after round-tripping from a five-month low near $68.74.
WTI and Brent crude surge in July as the Iran ceasefire collapses
July 31, 2026
View chart & download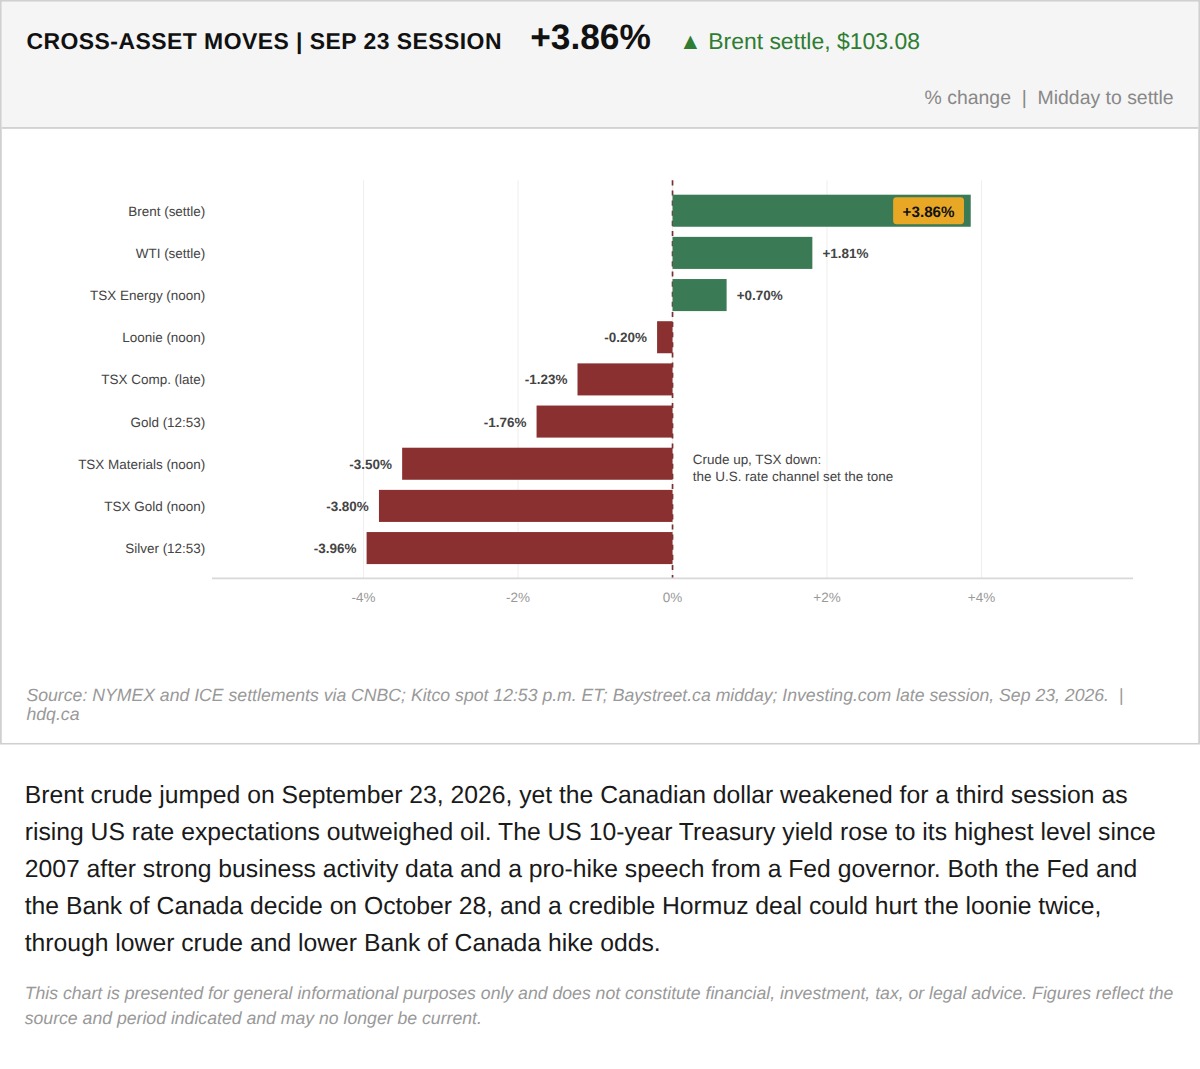
Brent crude jumped on September 23, 2026, yet the Canadian dollar weakened for a third session as rising US rate expectations outweighed oil.
Brent Jumps While the Canadian Dollar and TSX Fall in the September 23 Session
September 23, 2026
View chart & download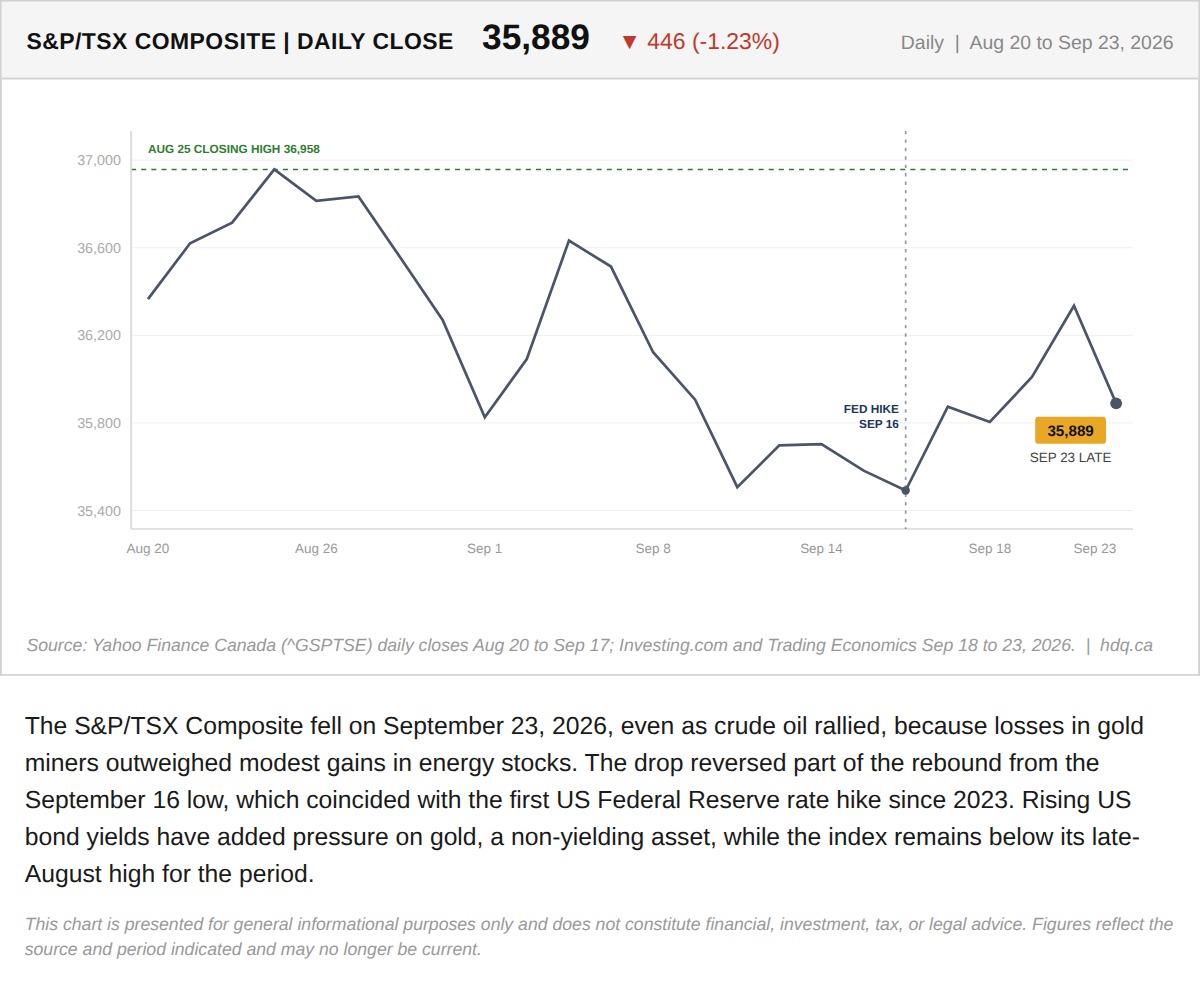
The S&P/TSX Composite fell on September 23, 2026, even as crude oil rallied, because losses in gold miners outweighed modest gains in energy stocks.
TSX Composite Falls Despite an Oil Rally as Gold Stocks Slide
September 23, 2026
View chart & download